
Read through our market commentary here, or skip to Jason’s July 2023 Market Update video below.
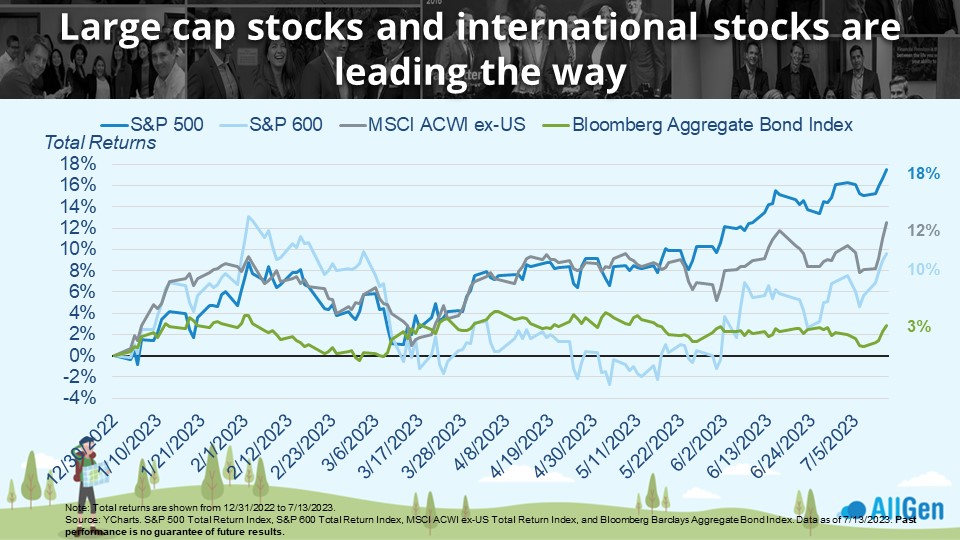
Investors spent most of the first half of 2023 wondering if markets would sustain the previous year-end bounce or continue to fall as the Fed pumps the breaks on the economy to fight inflation while attempting to avoid recession in the ultimate balancing act. In the chart below, we see most market indexes flourished in January of 2023, especially U.S. small-cap stocks that led the way up over 12%. By late March, most broad market indexes had erased nearly all gains for the year, largely fueled by headlines around the March 2023 regional banking crisis. Since then, market indexes have been appreciating steadily with the S&P 500 (U.S. large-cap stocks) now leading the way, up 18% for 2023.
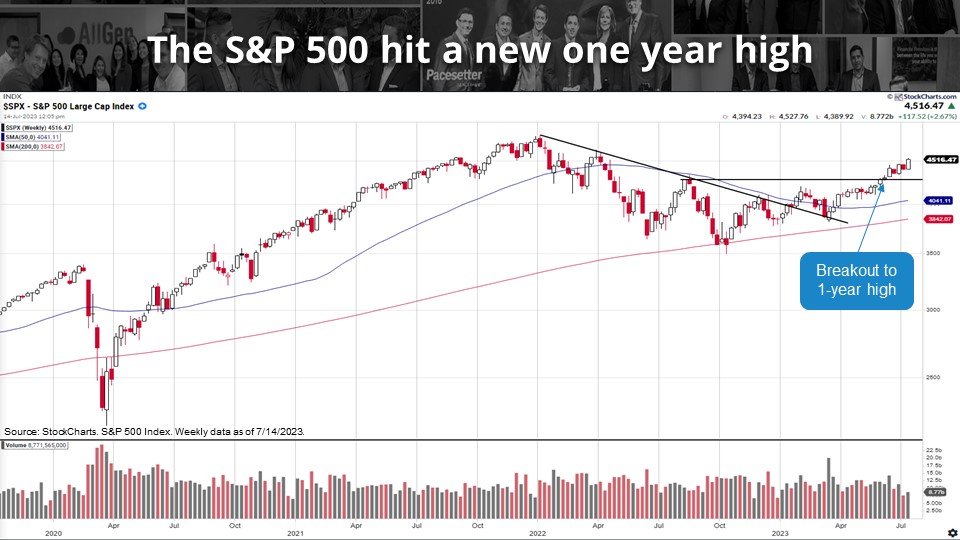
S&P 500 One-Year Highs
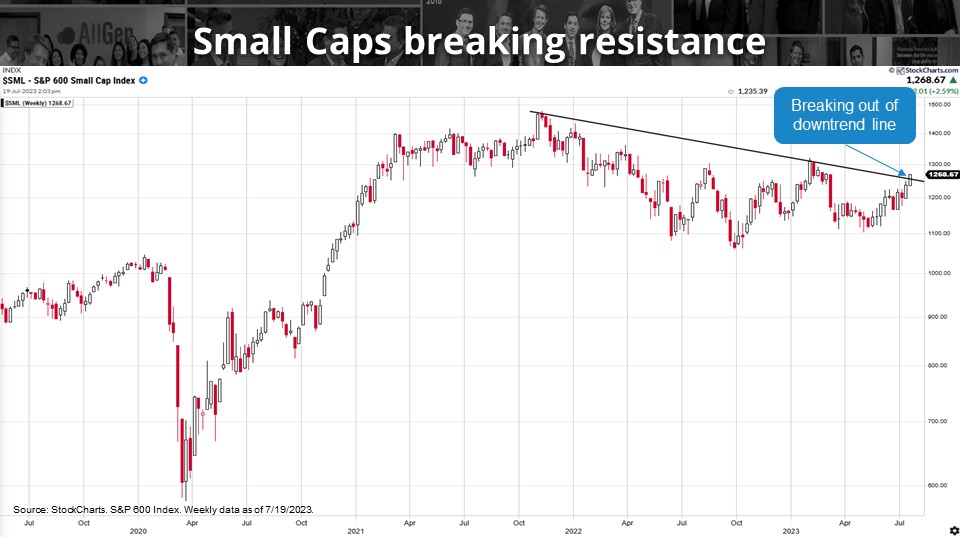
The chart below clearly indicates the S&P 500 has achieved new 1-year highs which has officially entered a new bull market. From October 2022 to today, the S&P 500 is up over 20%. Investors might find this perplexing considering 2023 so far had its share of recessionary concerns such as Fed tightening, stubbornly elevated inflation, and inverted yield curves; markets typically “climb a wall of worry” a phrase commonly used on Wall Street. By plotting trendlines using technical analysis, we’re able to visualize “breakouts,” indicated by the blue boxes, that can offer insights into where markets might be headed. We find another bullish breakout in the earlier stages of small-cap stocks when applying technical analysis in the second chart below.
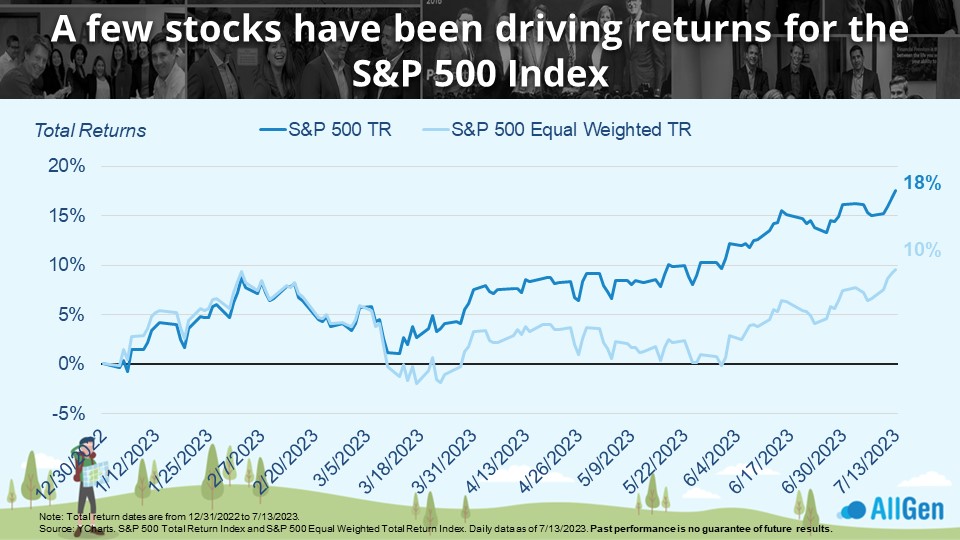
Market Cap-Weighted vs. Equal-Weighted Stocks
Most people know the S&P 500 as a basket of large U.S. companies, but many forget how these 500 companies are weighted in the index. The S&P 500 incorporates the top 500 U.S. companies weighted by market cap. For example, Apple and Microsoft are among the largest companies by market cap in the world, meaning they carry the highest weightings in the index. When comparing the performance of the S&P 500 (market cap weighted) with an equal-weighted S&P 500 index (chart below), we can see that the market cap-weighted index has outperformed. Technology stocks make up the highest weighting and happen to be the top performers as investors have already nicknamed 2023 as the “AI rally.”
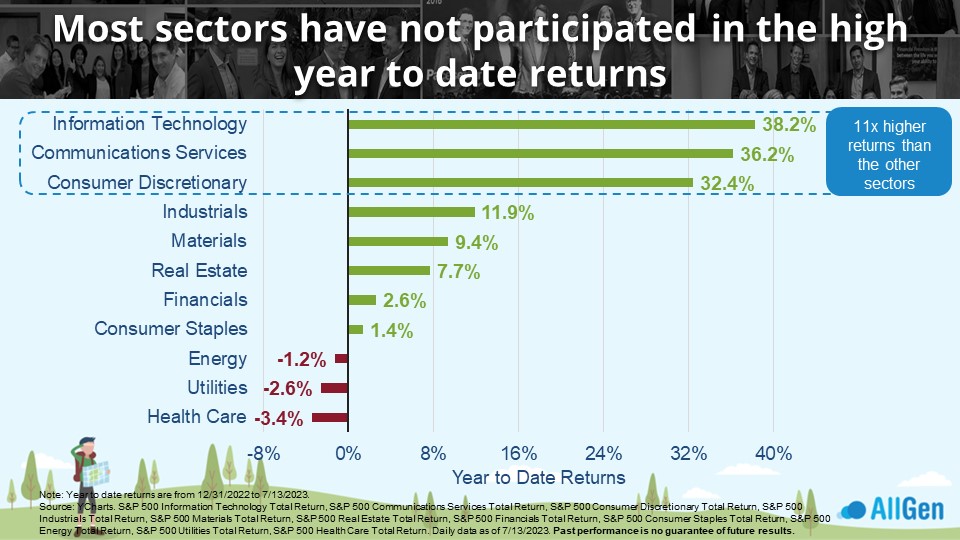
By further analyzing the returns of each sector we can reveal the main contributors to the S&P 500’s performance. Information Technology, Communications Services, and Consumer Discretionary have influenced index returns the most, by far (chart below).
Growth Stocks vs. Value Stocks
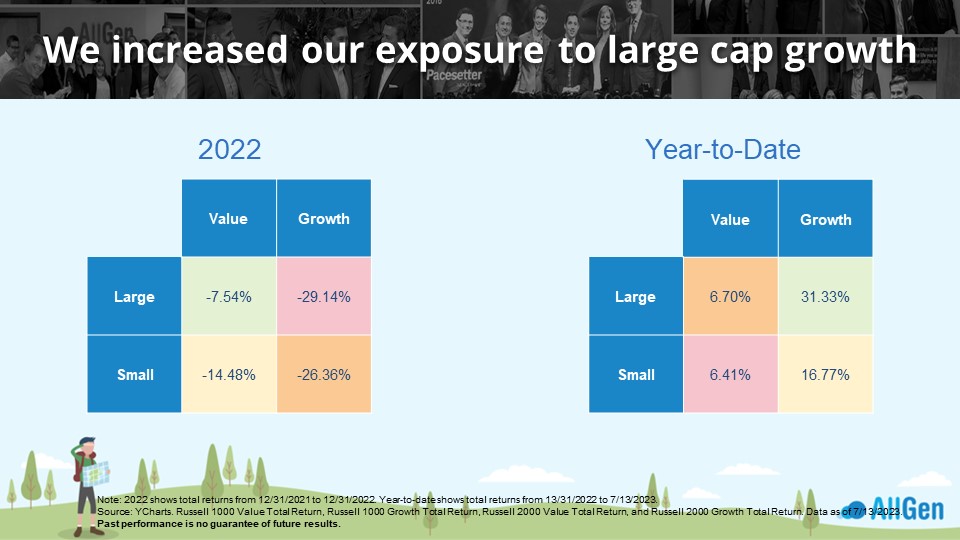
Diversified portfolios will typically include, among others, a balance of growth stocks (fast-growing, risky, high prices relative to earnings, and typically technology) and Value stocks (steady growth, established business, low prices relative to earnings, and consistent profits). Referenced on the left-hand side in the chart below, 2022 was a difficult year for growth stocks (-29.14%) while value stocks held up much better (-7.54%); we spent most of 2022 overweight value stocks which helped cushion client portfolios. Growth stocks, which performed the worst in 2022, are now performing the best so far for 2023 at 31.33% vs. 6.70% for value stocks. AllGen has already been adding to growth in client portfolios.
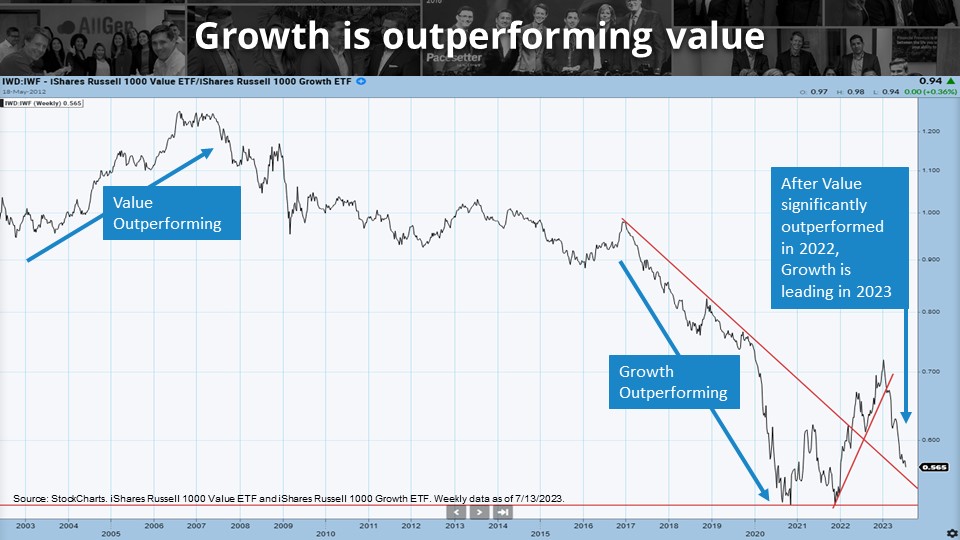
Over time, growth and value stocks normally outperform one another over multi-year time frames. You may recognize this one below as we frequently monitor the performance relationship between growth and value; a rising line indicates value stocks are outperforming, and a declining line indicates growth stocks are outperforming. While this chart only dates to 2002, if we were able to plot this relationship further back, we would find that value stocks tend to outperform over larger timeframes. The recent sharp decline on the right-hand side indicates outperformance in growth stocks where we are closely monitoring technical support and resistance levels.
Stock Market Seasonality
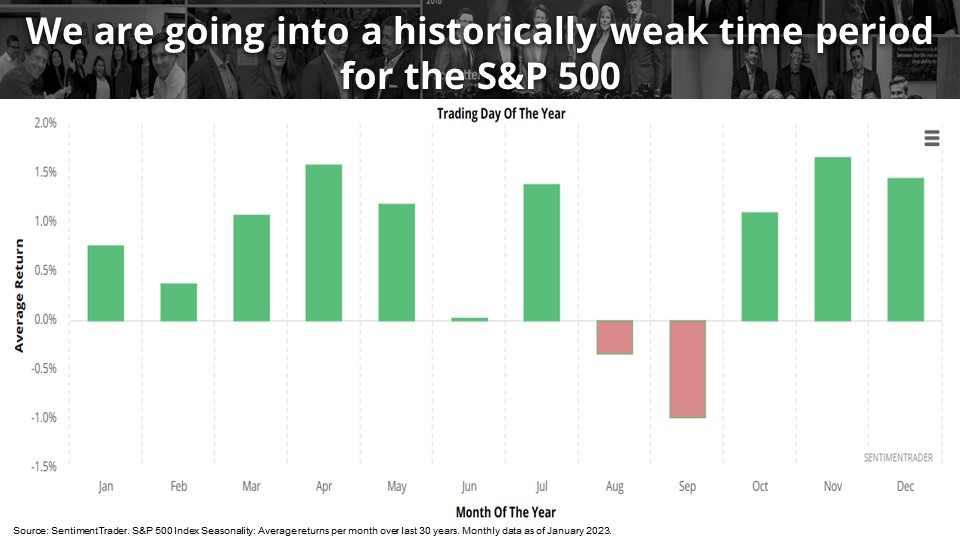
Stocks have no doubt received lots of investor attention in 2023 however, we must address seasonality. Historically, markets struggled in the months of August and September and over the last 30 years have averaged nearly -.5% and -1% for the respective months. The chart below averages each month in the S&P 500 over the previous 30 years. Of course, historical returns are not indicative of future returns, however, it is possible that markets might take a breather in the near term as we enter a historically weak time for stocks. Over the next few months, it may be advisable to speak with your advisor about creating a game plan for deploying excess cash.
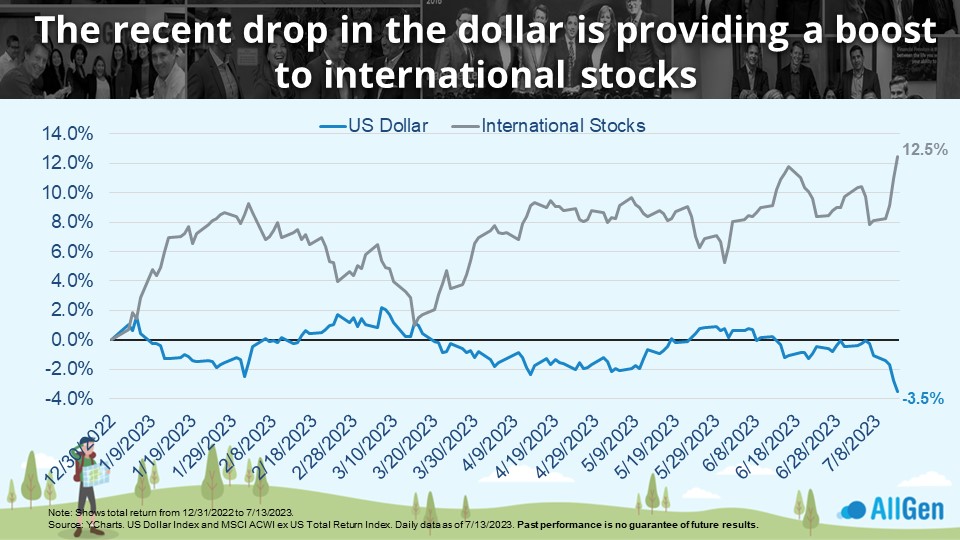
Recent Drops in the Dollar
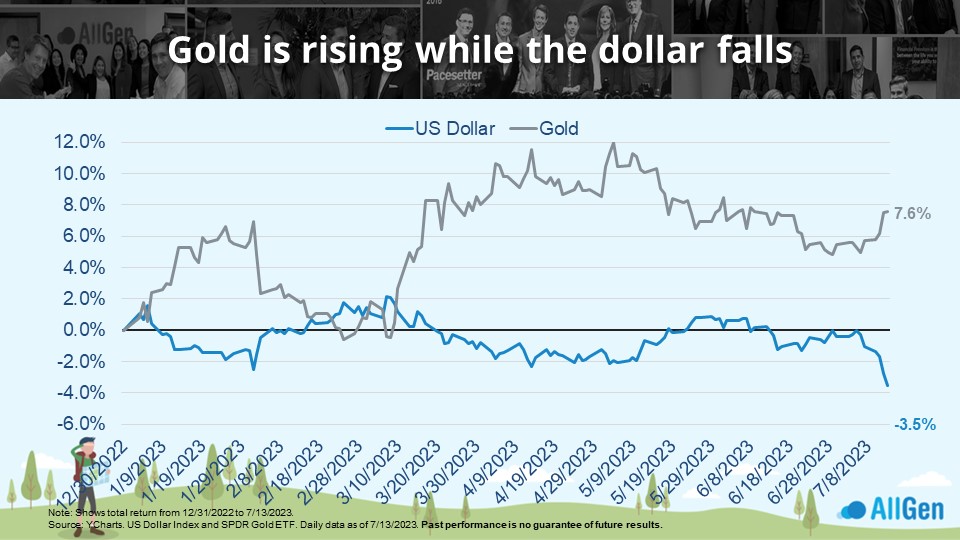
A weakening dollar has made recent headlines that many believe to be correlated to market fears when in reality the dollar is more correlated to interest rates. We’ve received questions relating to the dollar’s global dominance and what that could mean for buying physical gold which we address in our blog here: Should I Invest in Gold?
Gold isn’t the only investment that typically performs well when the dollar weakens. When investors see the dollar weakening, they tend to seek more investments outside the U.S. dollar, internationally. The two charts below indicate the relationship between the dollar (blue line) with gold (gray line) and with international stocks (gray line). Notice how the lines move inversely to one another, especially in July 2023 on the far right.
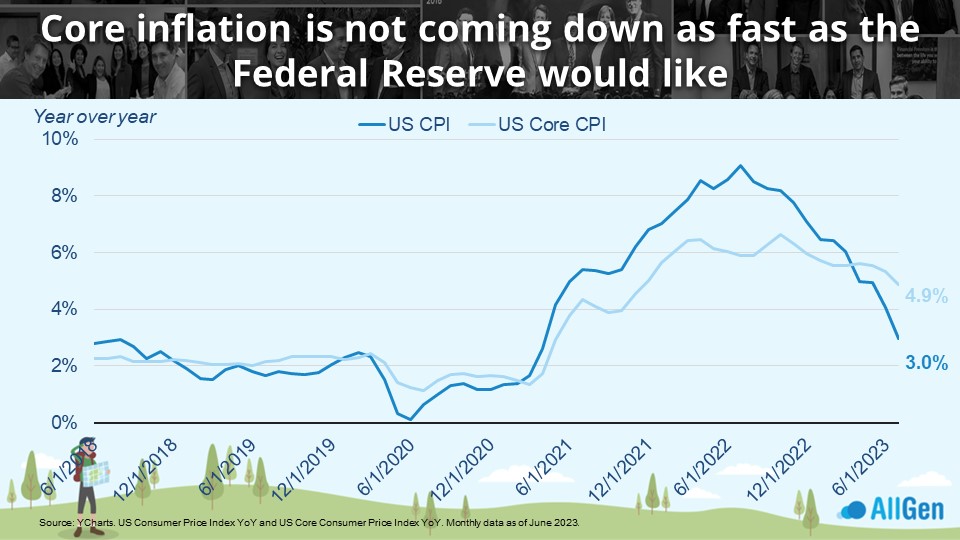
Consumer Price Index vs. Core Consumer Price Index
Most investors struggle to understand the difference between CPI and Core CPI. CPI stands for Consumer Price Index which measures total change in prices paid by U.S. consumers based on a basket of goods and services. Core CPI represents Consumer Price Index excluding more volatile items such as food and energy. U.S. CPI (dark blue) has achieved 3% year-over-year as of June 2023 from nearly 9% in June 2022; notice U.S. Core CPI (light blue) is declining at a slower rate.
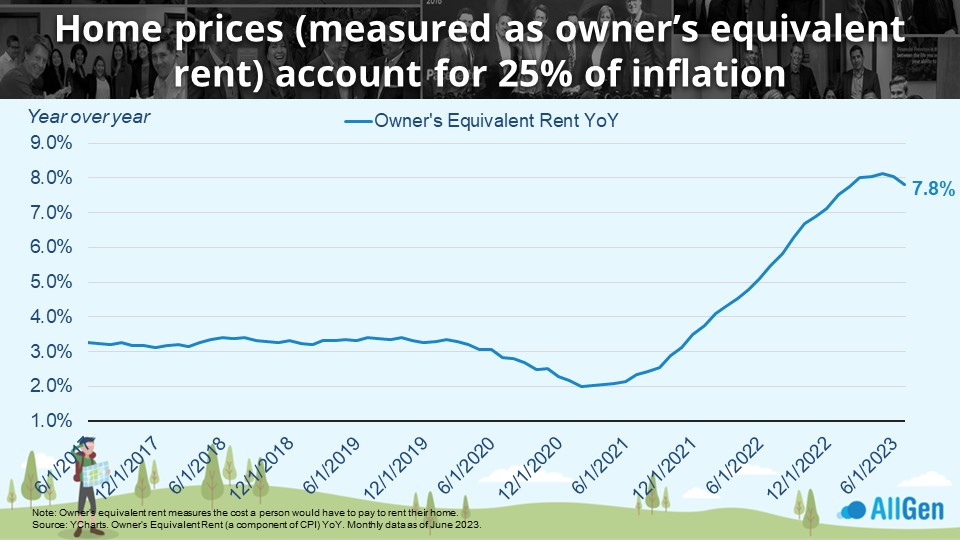
Home Prices and Inflation
Home prices, measured by owner’s equivalent rent, make up a large portion of the CPI calculation and remain elevated while showing signs that price increases are beginning to slow. The chart below illustrates that owner’s equivalent rent is clearly turning a corner; however, prices are still increasing 7.8% year-over-year as of June 2023. This is a key contributor to the slow decline in core inflation.
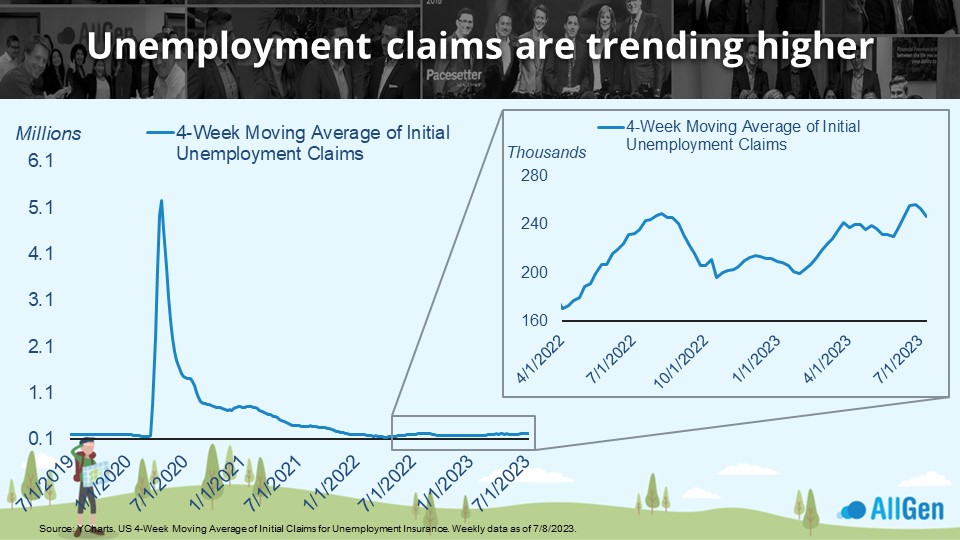
Inflation Trends and Unemployment
When analyzing inflation trends, we like to monitor initial unemployment claims. The chart on the left tracks the 4-week moving average of initial unemployment claims. The Covid-19 economic shutdowns caused nearly an overnight spike in claims which gradually declined in the 2 years following. Zooming to the last 15 months and into the breakout chart on the right, initial claims have been increasing. Despite the negative consequences that rising unemployment claims have on individuals, a weakening job market can help reduce inflation.
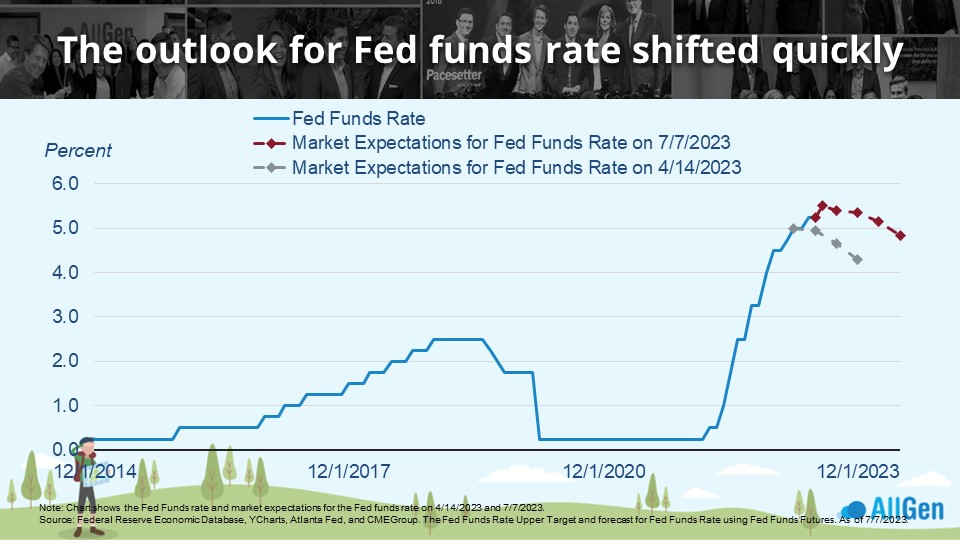
Fed Funds Rate Expectations
The Fed funds rate, which is the main tool the Federal Reserve uses to control economic growth and inflation, hasn’t always provided investors with clear expectations. The blue line in the chart below represents the actual interest rate at which the Fed implemented it. The dotted lines on the right indicate where expectations are and were. Back in April of 2023, markets expected rates to be lower than they are now. Given the economy and inflation have been relatively resilient since April, the Fed has decided to continue to push rates higher as it believes the economy can take additional contractionary pressure.
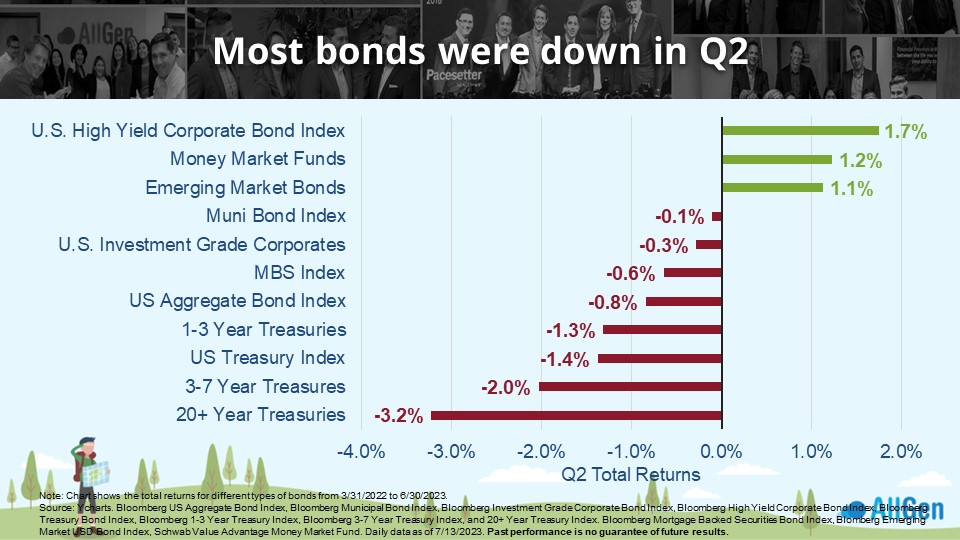
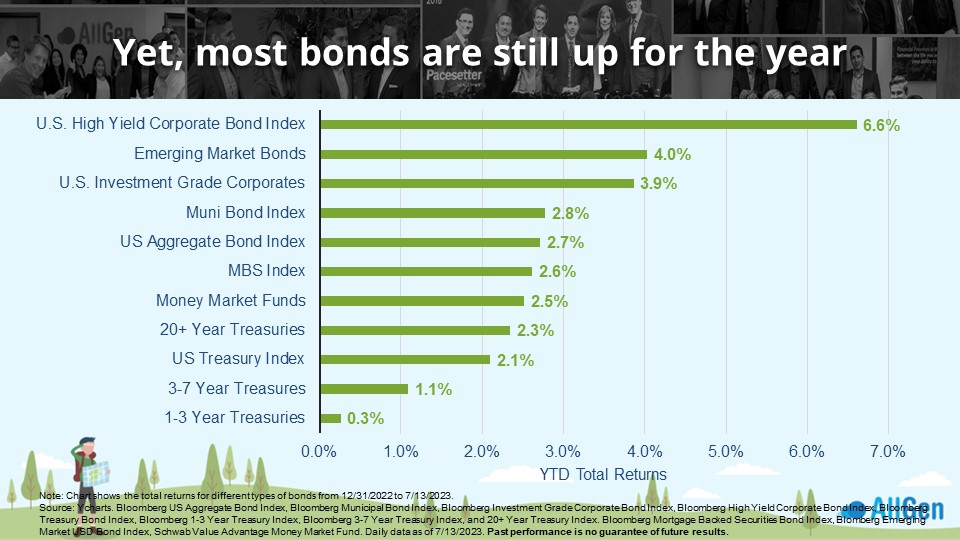
Bond Prices and Interest Rates
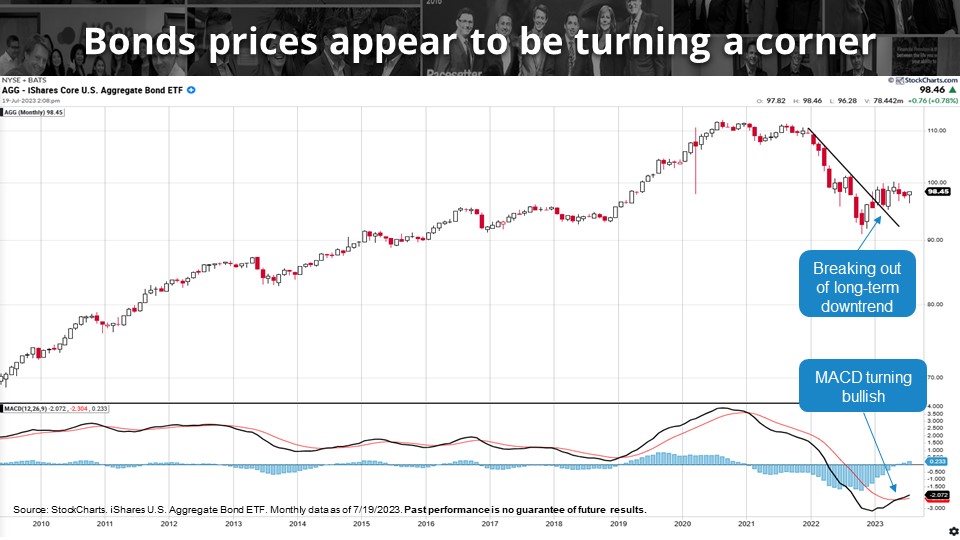
Bonds are coming off their worst year on record as the Fed nears the end of its most aggressive rate-hiking campaign ever. Bond prices move inversely to interest rates, meaning that when interest rates rise, bond prices typically decline and vice versa. In the second quarter of 2023, most bond prices were negative as the Fed updated its plan to continue hiking rates, putting additional downward pressure on bond prices (first chart below). However, for 2023 as of 7/13, most bonds are positive with high-yield U.S. Corporate bonds leading the way up 6.6% (second chart below).
Circling back to technical analysis and applying it to bond price trends, we can see that bonds have broken above a long-term downtrend. Additionally, MACD, which is a momentum indicator, has turned bullish which indicates a new upward trend could be forming.
Bringing It All Together: Emergency Reserves and Investment Opportunities
We believe markets could continue to appreciate through 2023. Referenced in our recent blog titled, The Roller Coaster of Investor Emotions, investors spent most of 2022 piling into cash at record rates. Many investors could still hold cash amounts that far exceed their recommended cash reserve levels; AllGen typically recommends clients keep at least three to six months of expenses in emergency cash reserves. For investors that may have cash exceeding three to six months’ expenses, it may be prudent to begin redeploying the excess into your investment accounts. For help with determining how much cash to hold as an emergency reserve and how much to invest, contact your advisor here!
For more information, watch the full July 2023 Market Update video below.
Important Disclosures: The information provided here is of a general nature and is not intended to answer any individual’s financial questions. Do not rely on information presented herein to address your individual financial concerns. Your receipt of information from this material does not create a client relationship and the financial privileges inherent therein. If you have a financial question, you should consult an experienced financial advisor. Moreover, the hiring of a financial advisor is an important decision that should not be based solely upon blogs, articles, or advertisements. Before you hire a financial advisor, you should request information about the financial advisor’s qualifications and experiences. Past performance is no guarantee of future results. All expressions of opinion are subject to change without notice in reaction to shifting market conditions. Data contained herein from third party providers is obtained from what are considered reliable sources. However, its accuracy, completeness or reliability cannot be guaranteed. Examples provided are for illustrative (or “informational”) purposes only and not intended to be reflective of results you can expect to achieve. AllGen Financial Advisors, Inc. (AllGen) is an investment advisor registered with the SEC. AllGen does not provide personal financial advice via this material. The purpose of this material is limited to the dissemination of general information regarding the services offered by AllGen. The Disclosure Brochure, Form ADV Part II, which details business practices, services offered, and related fees of AllGen, is available upon request.


