Read through the blog here, or skip to Jason’s April 2024 Market Update video below.
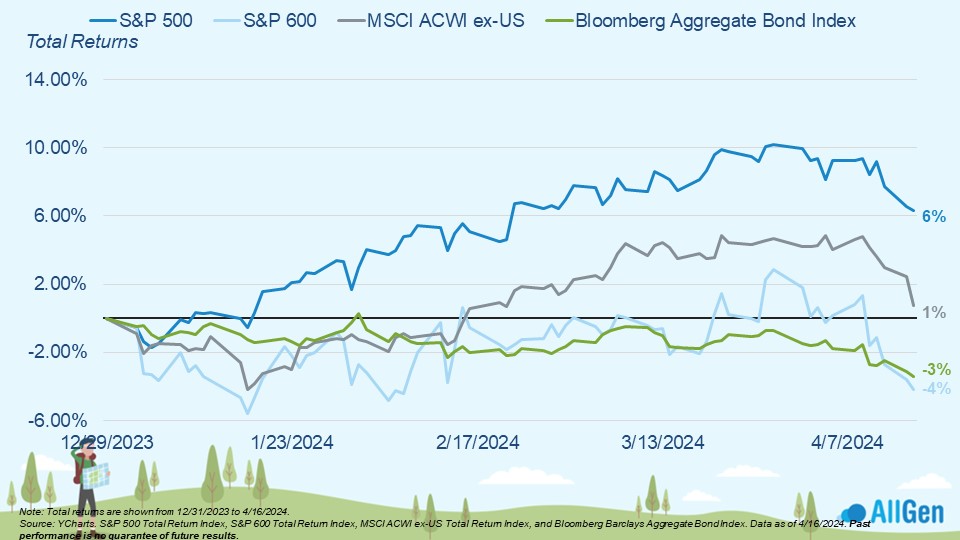
Markets began 2024 with divided returns among the top market indices with large U.S. stocks leading the charge for the first quarter of 2024, up 6% as of 4/16/2024. International stocks remain slightly in positive territory with bonds and small caps down -3% and -4%, respectively. Markets have given up some returns beginning this April, which we’ll cover more in depth later in the article.
Year-to-date returns for 2024
The Magnificent 7 Stocks and Their Earnings Dynamic
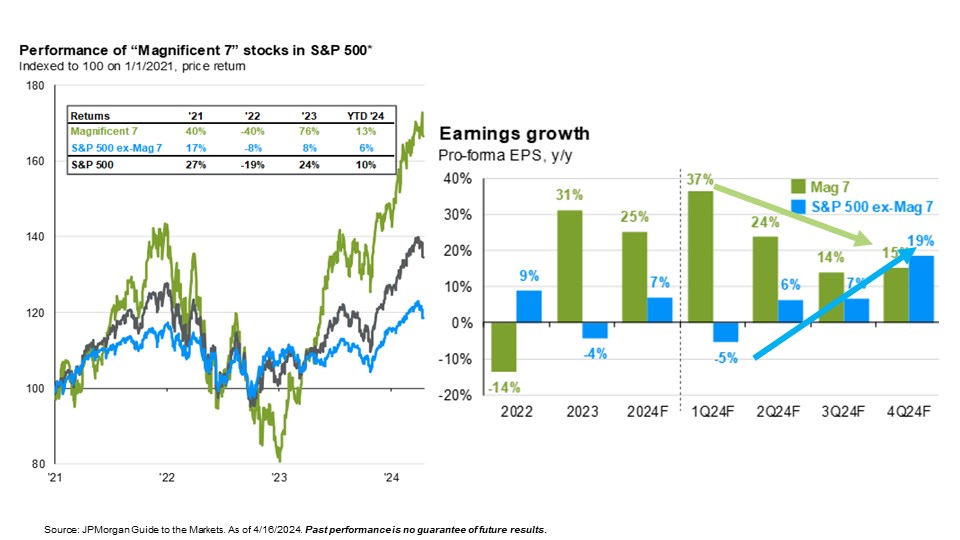
The Magnificent 7 (Mag-7) includes Apple, Microsoft, Alphabet (Google), Amazon, Nvidia, Meta, and Tesla, which together make up about half of the Nasdaq index and about 30% of the S&P 500. We mention this because a lot of recent market performance has been driven by these 7 mega-cap stocks. The green line in the chart below represents the performance of the Mag-7 and the gray line represents the S&P 500. If we remove the Mag-7 from the S&P 500 index to create the blue line, we can clearly see that good performance over the last year is largely thanks to the Mag-7. Moving to the bar chart on the right, we’ve plotted earnings growth estimates that are expected to come down for the Mag-7 but improve for the rest of the S&P 500. While we do hold mag-7 stocks in our model portfolios and have benefited from the recent performance, we are trimming some positions and rebalancing into stocks with better valuations.
The Magnificent 7 & earnings dynamic
Stock Price-To-Earnings Ratios
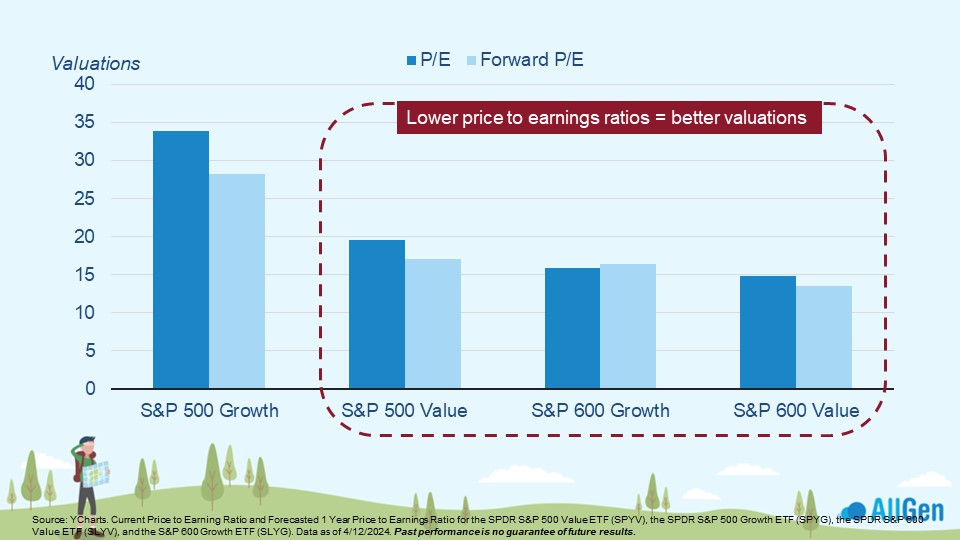
Speaking of valuations, a common ratio that we study is a stock price-to-earnings ratio, which is calculated by taking the current price of a stock and dividing it by its earnings per share. Additionally, we can calculate expected P/E ratios, which are called future P/E ratios. The higher the ratio, the more expensive the stock, and vice versa. We can see that small caps are currently trading at lower current and future P/E ratios, which suggests that the stocks are cheap. That said, they might be cheap for a reason – small-cap stocks tend to be more sensitive to higher interest rates and inflation.
Valuations for small-cap stocks and value stocks are more attractive
Growth Stocks and Value Stocks
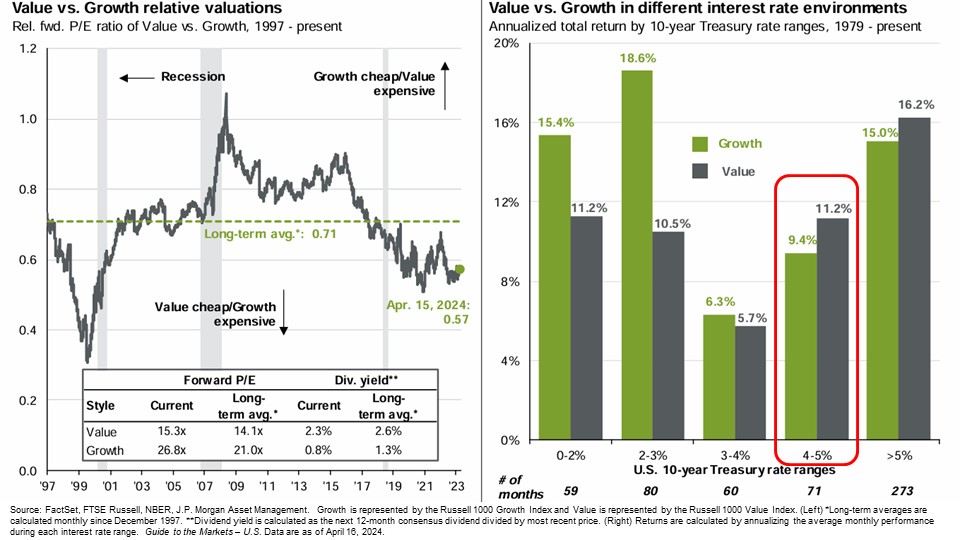
We frequently analyze the relationships between growth and value stocks. Diversified portfolios will typically include, among others, a balance of growth stocks (fast-growing, risky, high-priced relative to earnings, and typically technology-based) and value stocks (steady growth, established businesses, and low-priced relative to earnings and other valuation metrics). The chart on the left-hand side in the image below illustrates the relative forward P/E ratio of growth stocks and value stocks. When the gray line is above the green dotted line, growth stocks are trading at better prices, and when the gray line is below the green, value stocks are trading at better prices. Currently, value-oriented stocks are trading cheaper than their growth-oriented counterparts. Moving to the bar chart on the right, we take a look at the annualized returns of growth vs. value stocks since 1979. Historically, when the 10-year Treasury yield is between 4-5%, which is where it is today, value-oriented companies have seen better returns than growth companies.
Growth stocks vs. value stocks
International Stock Valuations
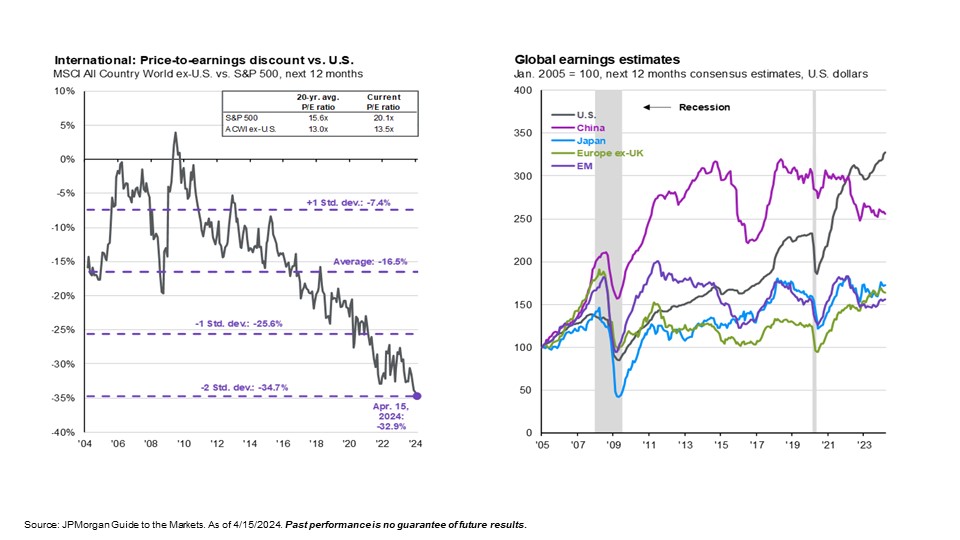
Moving on to international markets, we’re monitoring the historical discounts that international stocks have compared to U.S. Stocks. One of our favorite charts to reference is the chart below, which compares the 20-year average price-to-earnings ratios between the S&P 500 (large U.S. stocks) and the MSCI All Country World Index ex-US (international stocks). Generally speaking, the lower the price-to-earnings ratio, the better the valuation (and vice versa). We can see that when comparing the 20-year average P/E ratios between U.S. Stocks and international stocks, international stocks are trading at a significant discount.
Outperformance in International Stocks
While valuations might suggest certain stocks are cheap, it doesn’t always lead to outperformance and might take time before outperformance swings back in their favor. The chart on the right demonstrates that despite better valuation metrics in international stocks, earnings in U.S. stocks continued to outperform (see the gray line). However, from 2005 to 2009 earnings in international stocks outperformed, largely due to growth in China. AllGen has been underweighting international stocks through this time as U.S. stocks continue to dominate the global developed stock market.
International stocks are still a mixed bag
Inflation and Dollar Trends
Inflation is, and has been, one of the most talked-about financial topics for the last several years, and rightfully so. To recap, late 2020 and 2021 saw record economic stimulus following the COVID-19 lockdowns, which infused trillions of dollars into the economy in the form of wage increases, investing activity, and government spending. Interest rates were nearly zero to stimulate the economy. Inflation soon became a major issue that rose to levels around 9%–levels not seen since the 1980s (ycharts.com). This phenomenon was not constrained to the U.S., as most of the central banks around the world were also dealing with combating inflation.
Strength of the U.S. Dollar
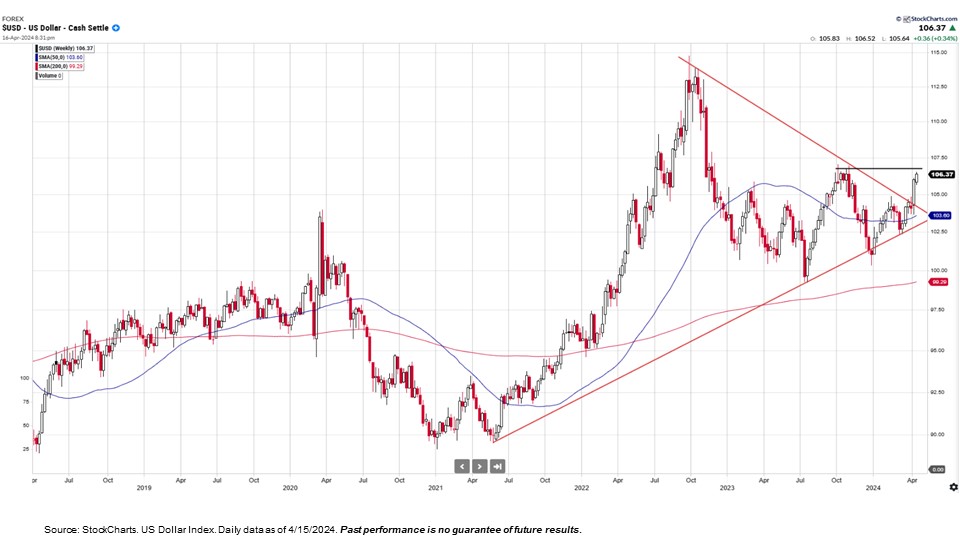
Despite record levels of inflation in the U.S., the U.S. dollar strengthened in relation to other currencies around the world. The strength of the U.S. dollar tends to be very correlated to interest rates, meaning that when interest rates rise, the dollar typically strengthens. The Federal Reserve is currently holding the Fed funds rate at between 5.25% – 5.5%, which is supportive of a stronger dollar – especially when you look at rates in other developed countries. Below, we chart the strength of the dollar and can see that in the last 5 years, especially when interest rates were rising, the U.S. dollar has strengthened. Even recently, we’ve been monitoring a technical breakout over the past few months that suggests the dollar could strengthen further. However, concerns over the U.S. national debt and enlarging deficits cause us to doubt the continuous strengthening of the U.S. dollar unless there are policy changes in the national budget.
The U.S dollar has appreciated over the last 5 years
Gold Prices
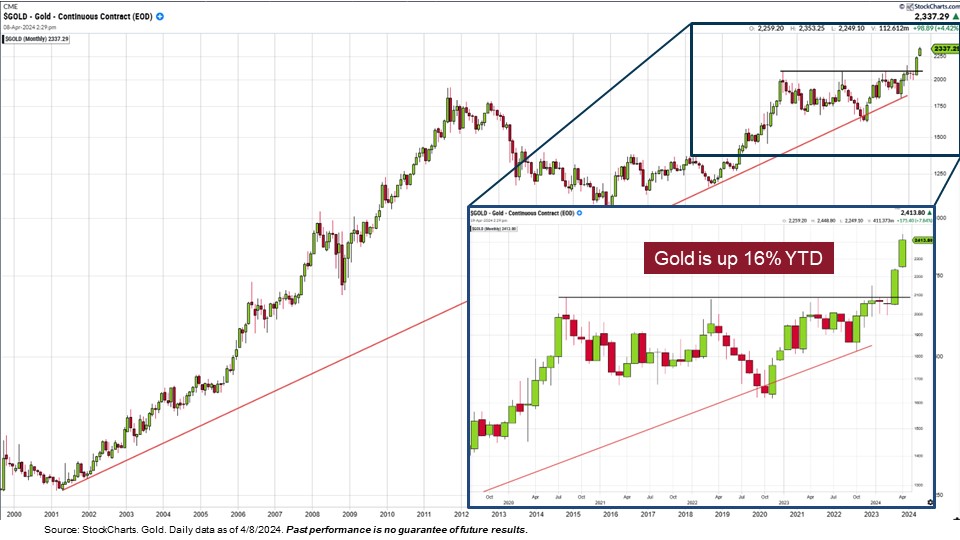
We closely monitor the price of gold and currently hold it in client portfolios. Over the last 24 years or so, gold has appreciated strongly, despite a downturn from 2012 to 2016. Gold can offer some diversification as it’s thought to be a “flight to safety” when markets get rocky. Gold has historically performed well in inflationary times. Gold also normally moves inversely to the trend in the U.S. dollar, meaning that as the dollar strengthens, the price of gold tends to weaken. That has not been the case in the last few months, however; the strength of the dollar and the price of gold have moved up together. Since gold can also act as a flight to safety in uncertain times and not just because of the state of the markets, we believe that gold’s recent spike relates to recent geopolitical issues surrounding the conflict in Israel and recent Iranian aggression. Gold is up 16% for 2024.
Gold is up 16% YTD
Gold Prices vs. Stock Prices in the S&P 500
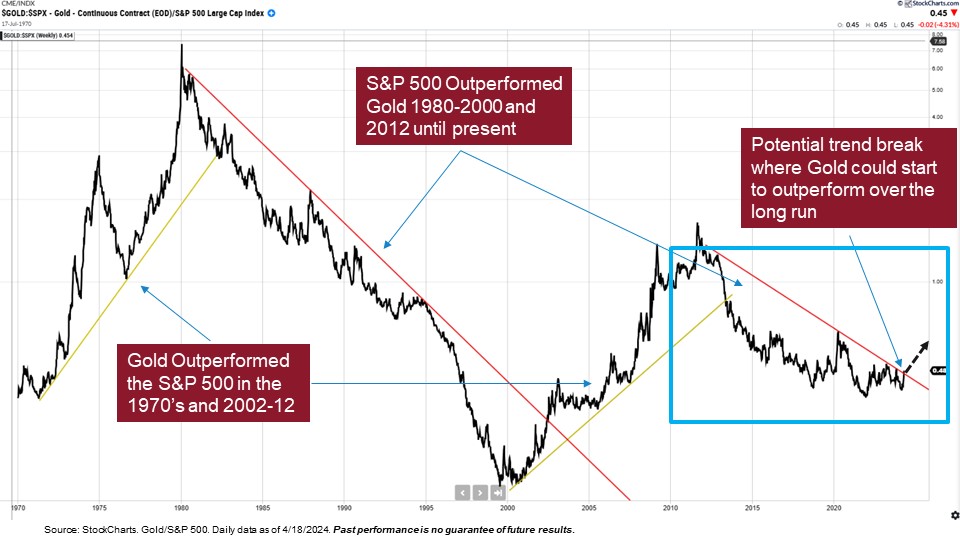
Below, we illustrate the relationship between the price of gold and stock prices in the S&P 500. The black line displays the relationship; when the line is going up, gold is beating the S&P 500, and when it’s going down, the S&P 500 is beating gold. See how one typically outperforms the other in large multi-year timeframes that sometimes last over a decade. Take note of how gold outperformed the S&P 500 during the 70s, which has many similarities to current times, as both had tight labor markets, rising inflation, and rising interest rates. Stocks have mostly outperformed gold for most of the last 10 years. However, we’re currently against resistance, which would be a significant long-term shift in the trend if it were to break a little higher above the resistance trendline.
Gold/S&P 500
Should I Invest in Gold?
We do not generally recommend buying gold bars or coins and storing them in your house. as there are several negative consequences. Buying physical gold involves large commissions on the way in and out that increases costs and lowers total return. Also, the burden of storing gold can become complicated and expensive. We use exchange-traded products, which are investment trusts that hold physical gold for low fees and can be held in an investment account just like individual stocks and bonds. This is how we implement gold allocations in our client portfolios.
Inflation in 2024
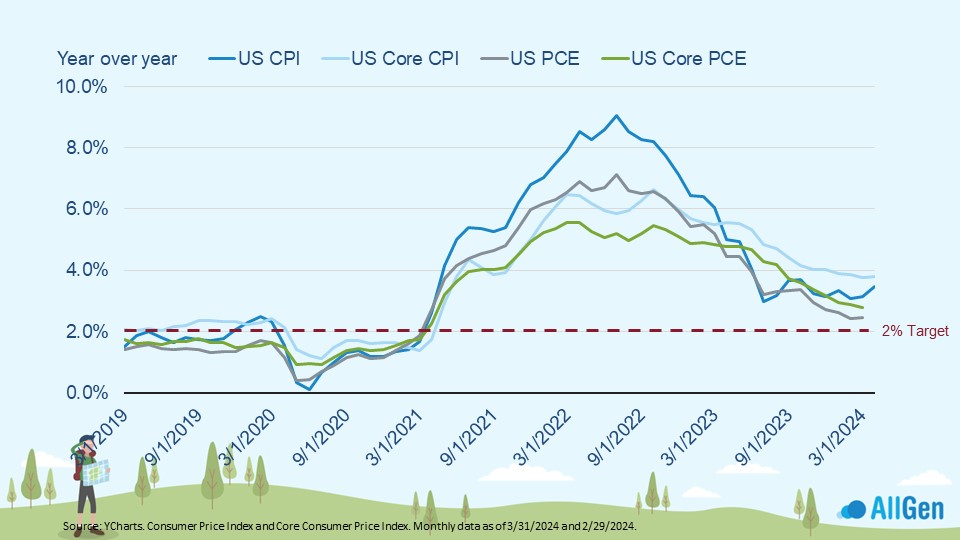
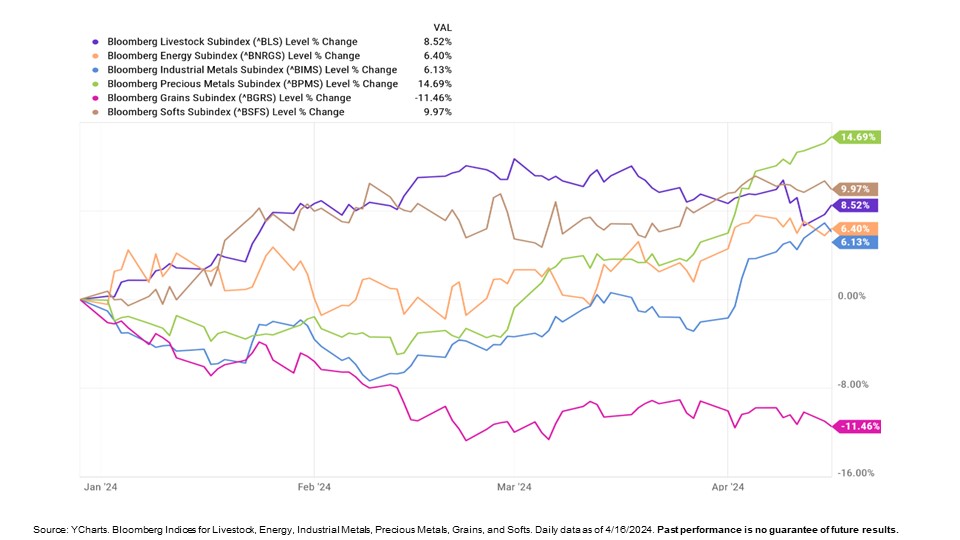
Although inflation has come down from its peak, it remains top of mind for investors, as it lingers closer to 3 to 3.5%; the Federal Reserve’s long-term target is 2%. Typically, commodities perform well in inflationary times, as seen below. Precious metals, soft commodities (coffee, cocoa, sugar, etc.), and livestock have led the way in 2024 so far, up nearly 14%, 10%, and 8.5%, respectively.
Inflation metrics remain above 2% targets
Most commodities are up for 2024
Areas of Strength in the Economy
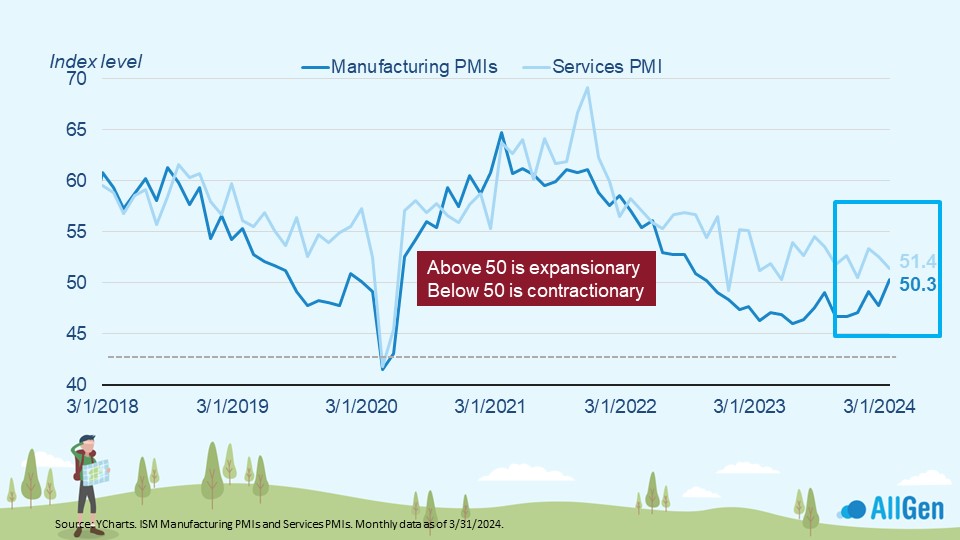
Although the Fed’s main tool to fight inflation is raising interest rates to slow the economy, the economy remains strong in a number of areas. ISM Manufacturing Purchasing Managers Index pulled above 50 for the first time since October 2022. Readings above 50 mean expansionary whereas below 50 means contractionary.
ISM manufacturing PMI chart 1
Unemployment Rate and Wages
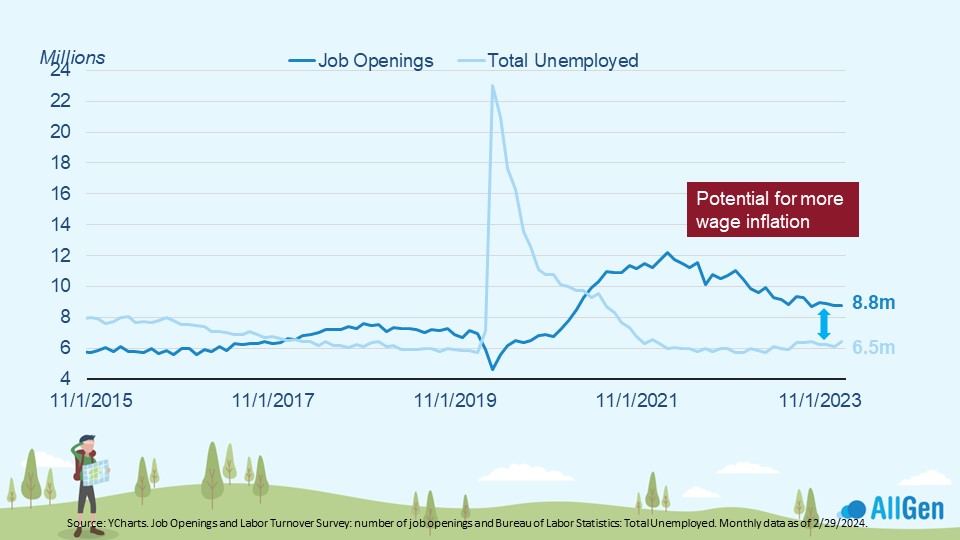
The shortage of workers has improved, but there are still 2.3 million more jobs than people who are unemployed. This drives wages up as employers need to pay up to attract and retain workers, which is also inflationary.
2.3 million more jobs than unemployed
Housing Prices
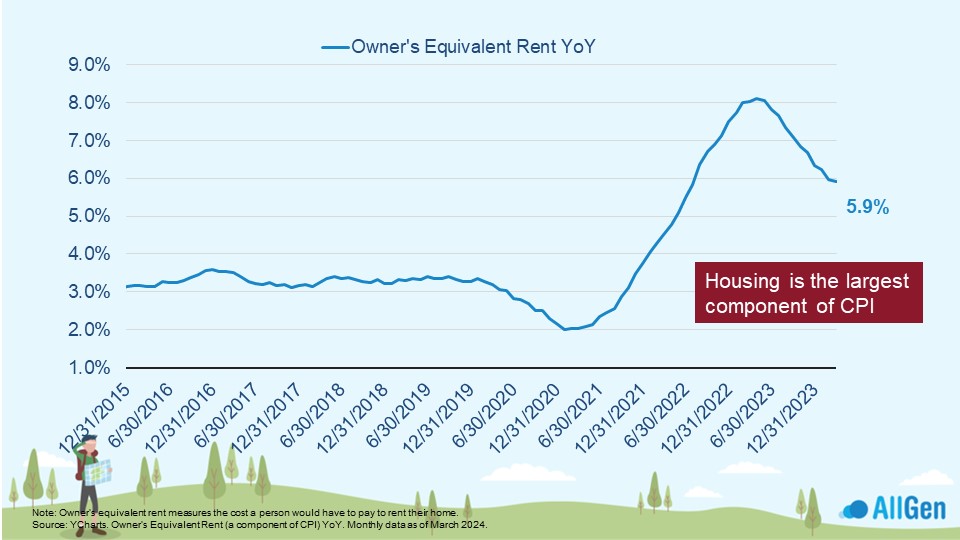
Home prices remain historically elevated, which happens to be the largest component in the consumer price index (CPI), a commonly used measure of inflation.
Home prices continue to rise
The Future of the Fed and the Markets
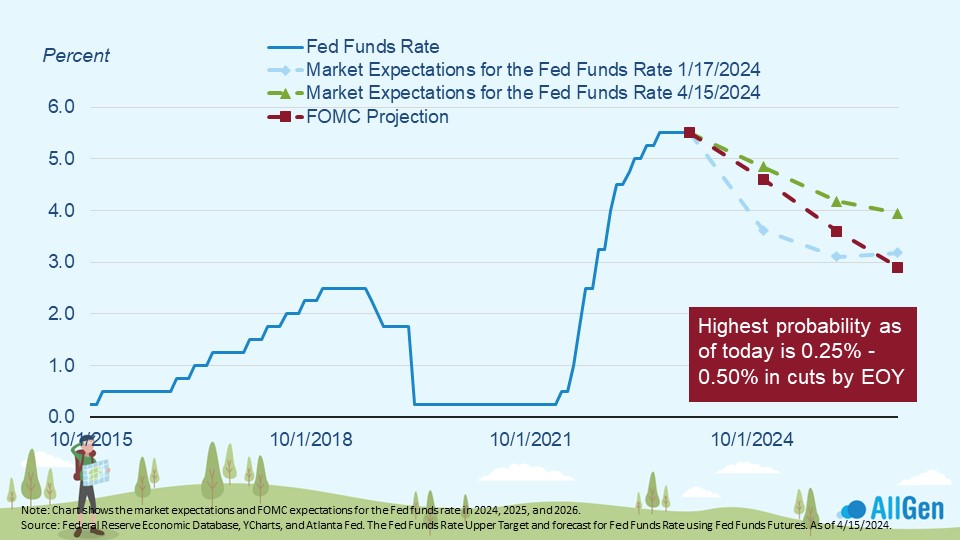
Markets anticipate the future, meaning that their direction might not make sense at the time. We’ve mentioned in past webinars that sometimes when sentiment is extremely pessimistic and headlines are overwhelmingly negative, it may indicate market bottoms with explosive recoveries to follow. The same can be applied to the Fed funds rate expectations. The light blue dotted line below was the market’s expectation for the Fed funds rate in January, while the green dotted line is the market’s expectation as of 4/15/2024. At the start of the year, investors were expecting a lower Fed funds rate by now, but that quickly changed, sending yields higher. Jerome Powell, Chairman of the Federal Reserve, has recently indicated a “higher-for-longer” approach in response to a stronger-than-expected labor market and inflation.
Market expectations for future Fed funds rates are shifting upward
Bond Prices
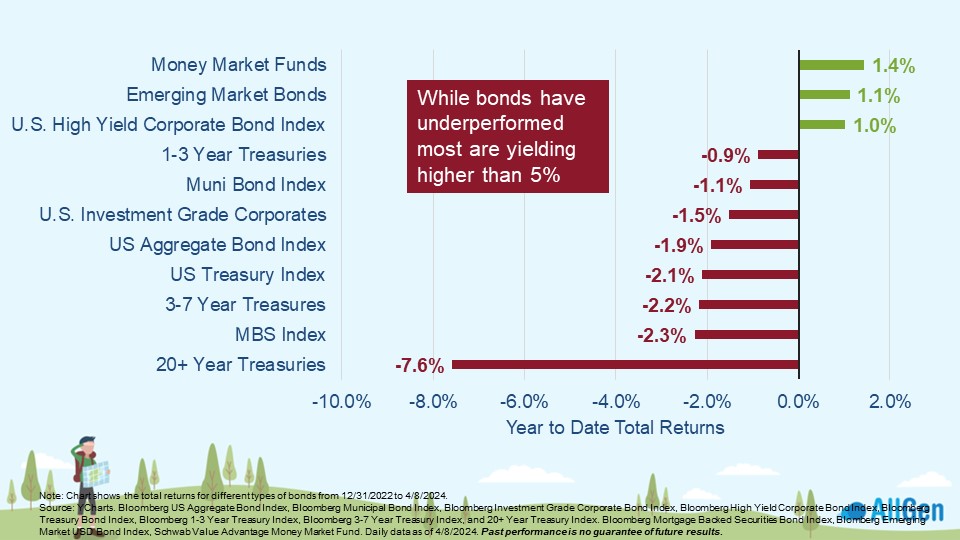
Broadly speaking, bonds are down year-to-date. Keep in mind that bond prices fall when yields rise and longer-term bond prices are more sensitive to changes in interest rates. Much like the stock market, the bond market also anticipates the future. Markets were anticipating lower interest rates by now. As the Fed revises its outlook and keeps rates elevated, it’s putting downward pressure on bond prices. Yet, if you dig a little deeper into the different areas of the bond market, you will find more of a mixed bag.
Long-Term Treasuries
As mentioned earlier, the bond category that is most sensitive to changes in rate expectations is longer-term bonds; see below that 20+ year treasuries are down the most for 2024. We have reduced exposure to longer-term bonds in client portfolios. On the flip side, money markets, emerging market bonds, and U.S. corporate bonds are positive for 2024. Reducing exposure to longer-term bonds (reducing duration) can help reduce risk on the bond side of portfolios. Although bond prices have been weakening for much of the last few years, they’re now paying yields close to 5% and higher, which we haven’t seen for much of the last decade and does provide some cushion for price declines.
Longer-term bonds are more sensitive to interest rate changes
Consumer Health and Excess Savings
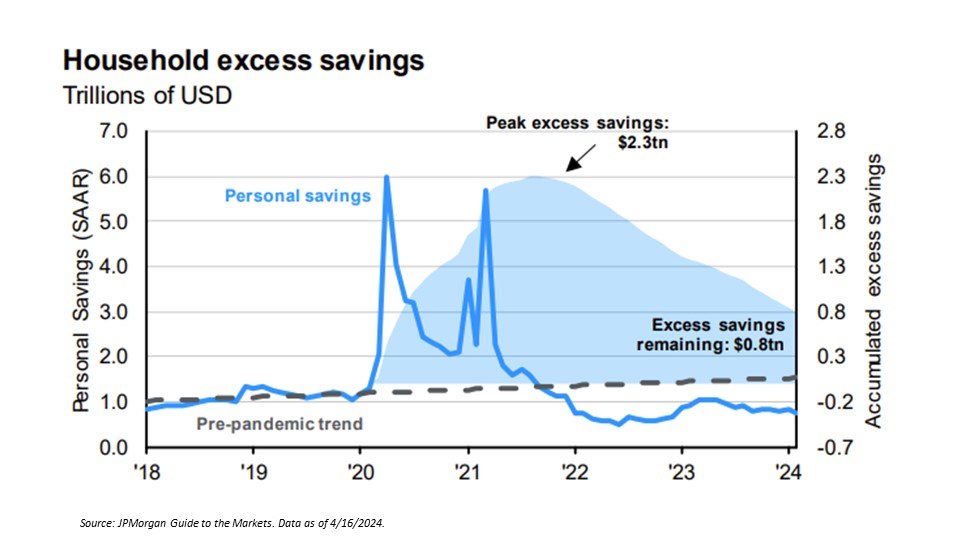
Analyzing the health of the consumer can offer an informative pulse on the economy. The chart below plots the personal savings rate of consumers (see the blue line), which has been below average for more than 2 years. This might initially sound alarming, but the savings rate is lower than average because of excess savings that consumers have built up since the pandemic. The peak excess savings in mid-2021 was $2.3 trillion, indicated by the shaded blue area. Since then, it’s dropped to $800 billion – a drop of $1.5 trillion in 2-3 years – and is expected to decline further.
Consumer Debt
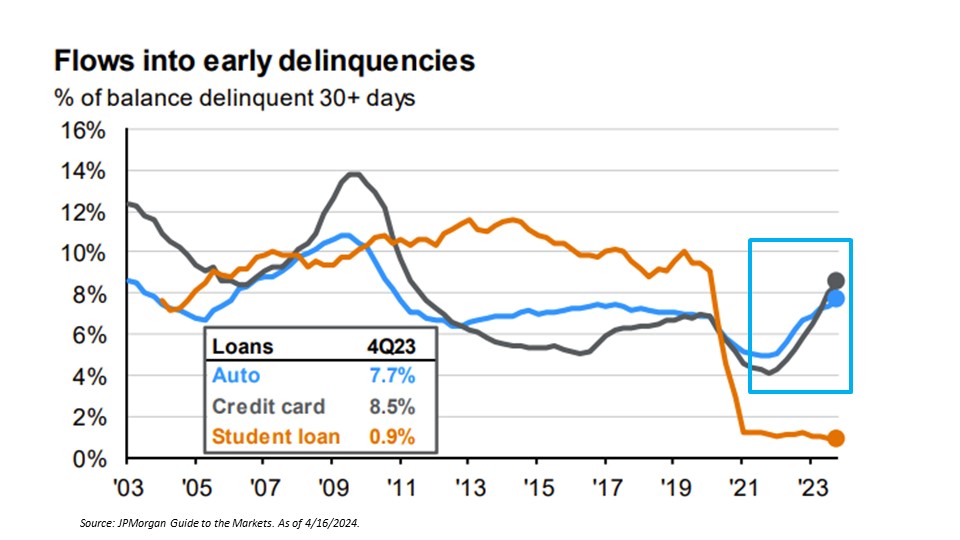
Another area that we are closely watching is delinquencies – debt has been piling up with delinquencies on the rise. In the chart below, we can clearly see that credit card and auto loans delinquent by more than 30 days have been growing and currently are at or near 10-year highs. This can put strain on the consumer that prevents them from spending more in the economy, constricting economic growth as consumer spending accounts for more than 70% of the U.S. GDP.
U.S. Government Deficit
Not only is financial pressure on the U.S. consumer growing, but it’s also prevalent within the U.S. Government with a rising deficit. A deficit simply means that spending is greater than generated revenue. As it relates to governments, it means that government spending is greater than tax revenue. That difference must be funded somehow and is typically covered in the form of debt. This debt needs to be paid back and is currently more expensive to do so with interest rates near 23-year highs (ycharts.com).
Historic Deficit Levels
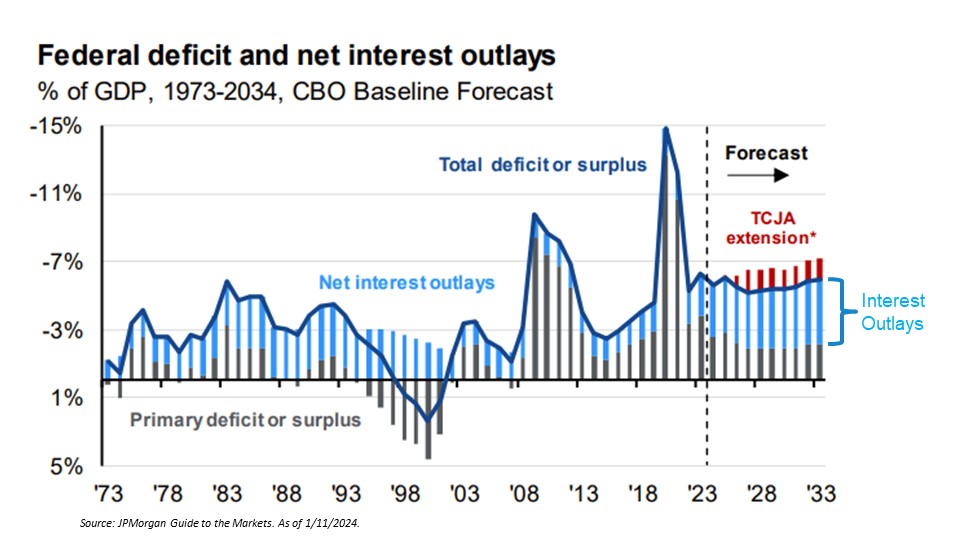
The chart below illustrates historical deficit levels since the 1970s as a percentage of GDP. Since the financial crisis of 2008, deficit levels as a percentage of GDP have been elevated, however, net interest outlays (see the blue bars) were a smaller portion of the total deficit because rates were low. On the far right side of the chart, notice how the blue bars are projected to be much larger than they were in the last 10 years, which represents higher future costs to service the debt that is taken on today. We are closely monitoring the deficit issue as it may become a long-term issue.
Deficits and rising interest expenses
Expected Market Volatility
The economy has generally been stronger than expected over the last few years, however, we expect volatility as the economic cycle ages and valuations move higher, especially in the Magnificent 7. We’re already seeing volatility in the bond markets as Fed officials adjust expectations to “higher-for-longer” for the time being. Geopolitical risks will likely continue and could lead to a risk-off environment. We have reduced bonds and reduced interest rate sensitivity while also trimming some gains in stocks. We’ve also increased our gold position for reasons mentioned earlier as we feel it will serve as a decent risk-off asset.
Discuss Your Investments With Your Financial Advisor
A well-diversified portfolio that focuses on managing risk first can help you weather the storm of volatility. If you feel you may have portfolios that lack diversification or are not prepared for today’s economic environment, contact your financial advisor today!
For more information, watch the full April 2024 Market Update video below.
Important Disclosures: The information provided here is of a general nature and is not intended to answer any individual’s financial questions. Do not rely on information presented herein to address your individual financial concerns. Your receipt of information from this material does not create a client relationship and the financial privileges inherent therein. If you have a financial question, you should consult an experienced financial advisor. Moreover, the hiring of a financial advisor is an important decision that should not be based solely upon blogs, articles, or advertisements. Before you hire a financial advisor, you should request information about the financial advisor’s qualifications and experiences. Past performance is no guarantee of future results. All expressions of opinion are subject to change without notice in reaction to shifting market conditions. Data contained herein from third party providers is obtained from what are considered reliable sources. However, its accuracy, completeness or reliability cannot be guaranteed. Examples provided are for illustrative (or “informational”) purposes only and not intended to be reflective of results you can expect to achieve. AllGen Financial Advisors, Inc. (AllGen) is an investment advisor registered with the SEC. AllGen does not provide personal financial advice via this material. The purpose of this material is limited to the dissemination of general information regarding the services offered by AllGen. The Disclosure Brochure, Form ADV Part II, which details business practices, services offered, and related fees of AllGen, is available upon request.


