Read through the blog here, or skip to Jason’s Managing Risk in Your Investments video below.
Key Takeaways:
- A portfolio that falls less than the market doesn’t need to beat the market on the upside to outperform over the long run – a portfolio that loses less needs less to recover.
- Not making a change to your investments when fear is high is a completely viable choice.
- Proper diversification can help minimize market drawdowns. AllGen’s investment philosophy revolves around proper risk management.
- Beware of headlines that can heighten your emotions and lead to rash decisions with devasting consequences for your portfolio – we suggest reviewing your financial plan before making a change to your investments.
Investing lingo can sometimes come from all directions. Headlines are often riddled with financial industry jargon intentionally engineered to awaken certain fear-based emotions that compel you to “buy or sell before it’s too late.” Investors who fall into this trap tend to forget the third, and possibly most important, choice: doing nothing. Doing nothing with your life savings can feel impossible when surrounded by emotional triggers; if you are having trouble keeping your emotions in check, consider reading our recent blog, The Rollercoaster of Investor Emotions, on how to remain disciplined and keep your investment portfolio diversified. People who understand this emotional dilemma will typically find themselves much less stressed about investing. As Benjamin Graham writes in his best-selling book, The Intelligent Investor, “The investor’s chief problem – and even his worst enemy – is likely to be himself.”
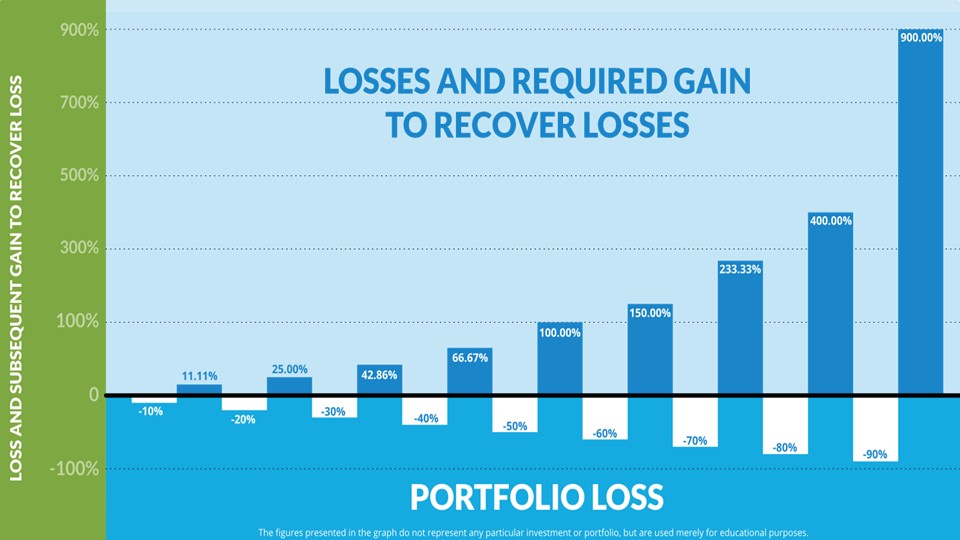
Investment Portfolio Losses and Breaking Even
Acknowledging our emotional human nature is arguably the most difficult obstacle to overcome because the consequences for a portfolio can be devastating. Let’s examine this sobering concept by using the chart below where we analyze different losses in a portfolio, and the required return to recuperate that loss (break-even). Starting on the left, a portfolio that’s down -10% will need 11.11% to recover the loss. Moving to the right, a loss of -50%, will need 100% (double your money) to become whole. Continuing to the far right, we find that the consequences worsen exponentially; a portfolio that is down -90% will need a 900% return to recover the loss, which can be impossible to achieve!
Diversification Can Help Protect Your Portfolios
Some tech companies that saw massive returns in the late 1990s also saw devastating losses by 2002, some of which lost more than 95%. This likely wreaked havoc on portfolios holding too many tech stocks. Maintaining diversification can help lower risk and cushion market downturns which can lead to advantages when markets recover – a portfolio that is down less than the market, needs less to recover!
Defensive Investment Risk Management Strategies
If you’ve played team sports, you probably remember your coach always yelling, “A good defense wins games!” I still hear it even 10 years later! Although playing defense may not be as fun as offense, the team with the better defense usually comes out ahead. When investing, a portfolio that holds up better on the downside, can still outperform over the long run!
Here’s how: If we invested $100,000 in the S&P 500 index in 2005, we would have around $364,000 by mid-2023 (light blue line). Hypothetically, if we invested in a way that captured only 90% of the downside, and only 95% of the upside, we’d have about $845,000 by mid-2023; an extra $480,000! Put more simply, if the index lost $10,000, the portfolio would have lost $9,000 and if the index gained $10,000 the portfolio would have gained $9,500. Notice that since this portfolio performed better on the way down, it didn’t need to recover as much when the index started rising. In fact, it didn’t even need to beat it! This means that a portfolio can significantly beat an index over time, as long as it’s more defensive when markets fall. The chart below illustrates the magnitude of this small adjustment. The light blue line represents investing in the S&P 500 whereas the dark blue line represents a portfolio that performs slightly better on the downside.
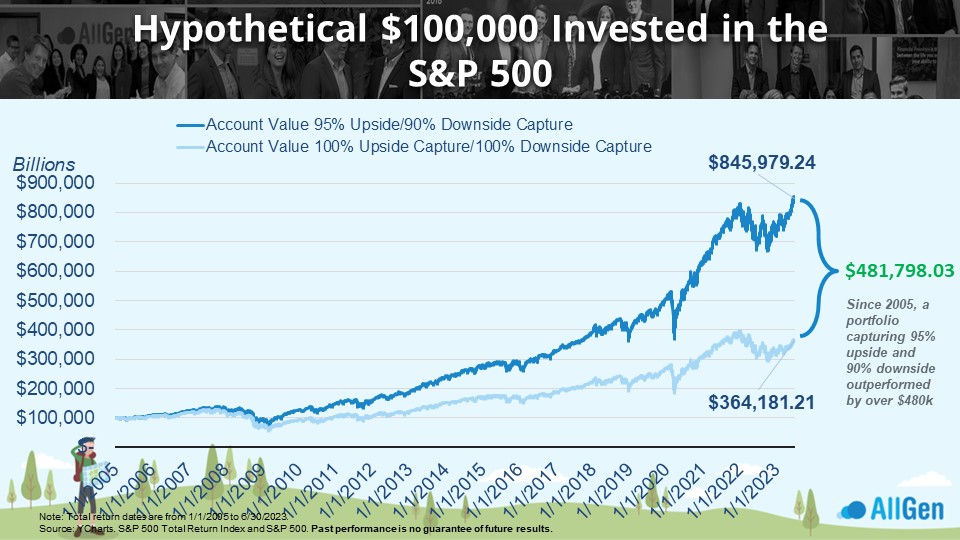
This seemingly simple relationship supports the idea that incorporating defensive elements in a portfolio may offer better-than-index returns over time. AllGen’s risk management philosophy prioritizes defensive holdings, which can offer some of the compounding advantages illustrated above.
AllGen Prioritizes Risk Management So You Don’t Have To
As part of our risk management framework, we use a variety of metrics to analyze risk within individual stocks and mutual funds. The goal is to find attractive investments that offer reasonable returns without as much risk. You might have heard the terms listed below used in the financial news but may not be familiar with what they mean so, let’s break it down!
Fund Fundamentals
Beta β: Measures volatility in relation to the market. If an investment has a beta of 0.9 and the market returns 10%, the investment should have returned 9%. If an investment has a beta of 1.1 and the market returns 10%, then the investment should return 11%.
Alpha: Measures fund outperformance over the market. An alpha of 1.5 means that a fund has outperformed the market by 1.5% and an alpha of -1.5 means that a fund has underperformed the market by 1.5%. Positive alpha means the fund is performing better than the market.
Upside/Downside Capture: How much of the upside an investment captures and how much of the downside; typically expressed as percentages. If the market is down -10% and downside capture is normally 90%, the investment should return -9%. If the market is up 10% and the upside capture is 95%, then the investment should return 9.5%. Ideally, investors want lower downside capture and higher upside capture.
Stock Fundamentals
Current Ratio: Current Assets/Current Liabilities This ratio indicates a company’s ability to pay off short-term debt. A current ratio above 1 means the company has more short-term assets to cover short-term liabilities. The higher the ratio the better.
Debt to Equity: Debt/Equity This ratio indicates the size of a company’s debt versus the net worth of the company (assets – liabilities). Higher debt to equity indicates that the company is using more debt to grow the business vs. shareholder capital. We generally look for a lower debt-to-equity ratio for any individual stocks we buy for clients.
Price to Earnings: Share Price/Share Earnings This ratio indicates how many times earnings a company’s price is trading. A higher price-to-earnings ratio indicates the stock could be overvalued whereas a lower price-to-earnings ratio indicates the stock could be undervalued. Sometimes price to earnings is referenced in headlines as “XYZ company is trading 20 times earnings.” This means that the price of the stock is 20x more than its earnings.
Free Cash Flow: The net cash flow from operations, investing, and financing activities. The higher the free cash flow the better. Probably the most important cash flow metric is positive cash flow from operations (CFO) which indicates that the business is generating profits on its own, excluding outside investor funding.
Risk Metrics vs. Diversification in Investing
Risk metrics can help with choosing investments, but diversification determines how much to allocate to each investment.
The financial metrics referenced above are just a handful of many that are used to analyze individual investments to build diversified portfolios. Another way to beef up your defense in your portfolio is to consider noncorrelated assets. The S&P 500 is certainly overreferenced in financial media, but not many people realize that It’s not a diversified index! Rather, it’s a collection of 500 of the largest companies in the United States weighted by market capitalization, excluding all non-U.S. companies, bonds, alternatives, and commodities – all of which deserve a spot in a diversified portfolio.
The Power of Diversification
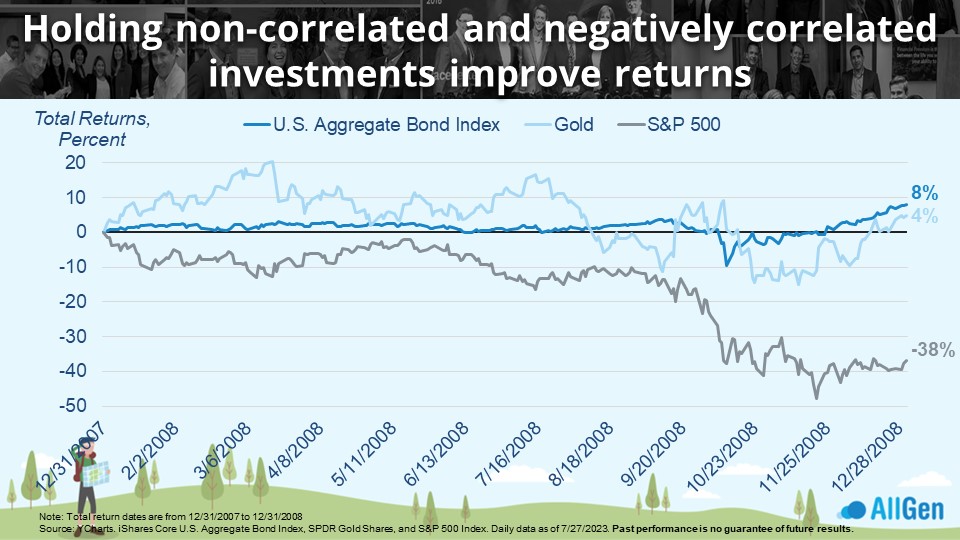
Some readers may remember living through the Great Recession of 2008 and the market drawdown that came with it – the S&P 500 fell -38% during the calendar year (chart below). A portfolio with $100,000 made up of only the S&P 500 would have been down -38% (-$38,000) and need more than 61.3% to recover back to $100,000. Over the same calendar year, U.S. bonds and gold were up 8% and 4% respectively. A portfolio that incorporated gold and bonds in addition to stocks would have declined far less. In fact, if your portfolio consisted of 70% S&P 500, 25% bonds, and 5% gold, in 2008 your portfolio would only be down only -24.4% (-$24,400) and would only need 32.3% to recover, which is a lot better than 61%! Again, a portfolio that is down less than the market doesn’t need to beat the market in recovery!
Bringing It All Together: Financial Planning and Investment Management
Even if the markets become volatile or the financial news grows worrisome, it’s important to consider not acting on what might be your gut instinct to sell. Making any changes to your investments because of fear or anxiety could hurt your returns in the long run. Because the foundation of any investment portfolio is having a good financial plan, it’s recommended that you speak with your financial advisor before making any changes. Your AllGen financial advisor can help you protect your investments through diversification and managing downside risk. After all, our philosophy is heavily driven by managing risk. If you don’t already have an AllGen financial advisor, contact us today to get started on our Path to Financial Freedom!
For more information, watch the full Managing Risk in Your Investments video below.
Important Disclosures: The information provided here is of a general nature and is not intended to answer any individual’s financial questions. Do not rely on information presented herein to address your individual financial concerns. Your receipt of information from this material does not create a client relationship and the financial privileges inherent therein. If you have a financial question, you should consult an experienced financial advisor. Moreover, the hiring of a financial advisor is an important decision that should not be based solely upon blogs, articles, or advertisements. Before you hire a financial advisor, you should request information about the financial advisor’s qualifications and experiences. Past performance is no guarantee of future results. All expressions of opinion are subject to change without notice in reaction to shifting market conditions. Data contained herein from third party providers is obtained from what are considered reliable sources. However, its accuracy, completeness or reliability cannot be guaranteed. Examples provided are for illustrative (or “informational”) purposes only and not intended to be reflective of results you can expect to achieve. AllGen Financial Advisors, Inc. (AllGen) is an investment advisor registered with the SEC. AllGen does not provide personal financial advice via this material. The purpose of this material is limited to the dissemination of general information regarding the services offered by AllGen. The Disclosure Brochure, Form ADV Part II, which details business practices, services offered, and related fees of AllGen, is available upon request.


