
Key Takeaways:
- Although we may not be in a recession quite yet, the risk of one is high.
- Stock markets tend to bottom out and rebound during recessions.
- We are staying up in credit quality to avoid bond defaults and extending duration to position for when rates fall; likewise, we are increasing exposure to quality growth stocks that will benefit from falling rates.
The most common question we’re asked right now is: “Are we in a recession?” A recession is a meaningful broad-based decline in economic activity over multiple months. The National Bureau of Economic Research (NBER) is the official organization responsible for dating recessions – often after the economy is already in one. Yet by this time, many of us may already be feeling the pain of the recession. That said, we are likely not in a recession quite yet, but the U.S. economy could go into one within the next 12 months.
As recessions relate to financial markets: markets tend to move in advance of the economy. Investors will often see stock markets, like the S&P 500, bottom during a recession and then rebound. Within bonds, we are staying up in credit quality to avoid bond defaults and extending duration to be prepared for when rates decline – keep in mind that when bond yields fall, bond prices rise.
Recession Indicators: Looking at the Health of the Consumer
71% of the U.S. economy is driven by consumer spending, which is why economists focus heavily on the health of the consumer’s finances. The year-over-year growth rates for the job market, income growth, and spending for consumers are all lower in 2023 than the peaks seen back in 2021.
NBER predominately looks at employment as measured by payrolls and household surveys to evaluate the job market. The rate at which jobs are being added to the economy has slowed since 2021 – from the 2021 peak of over 10%, jobs are now being added to the economy at a rate of 2.2% over the last year.
Jobs added to the economy are slowing
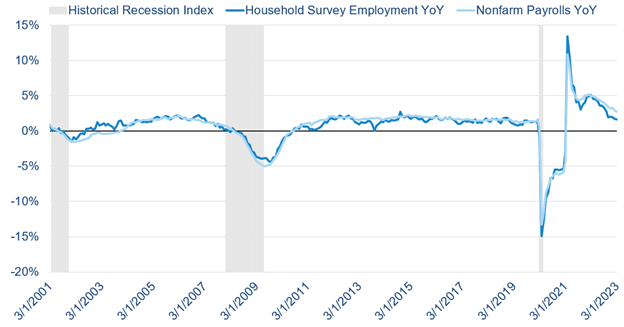
Source: YCharts and the Federal Reserve Economic Database. BLS Household Survey Employment year-over-year, Nonfarm Payrolls Year over Year, and Historical Recession Index. Monthly data as of March 2023.
Looking further up the jobs pipeline, most industries have experienced a decline in job openings over the last year. This translates to fewer opportunities available for those actively seeking a job. Over time, this will feed into payrolls, meaning fewer jobs will be added to the economy.
Job openings in most industries declined in the last year
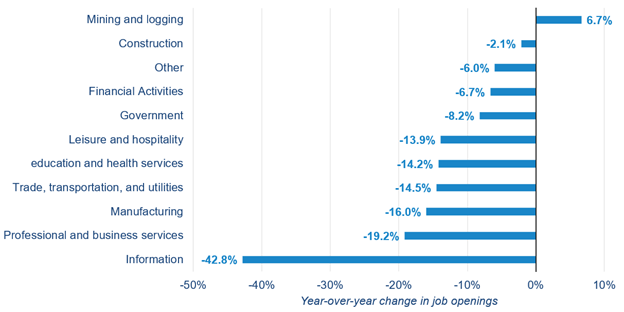
Source: YCharts. Job Openings and Labor Turnover Survey. Monthly data as of March 2023.
Similarly, the year-over-year change in personal income adjusted for inflation (real income) and government income subsidies (transfer payments) has declined from the 8.4% high in 2021 to roughly 2.1%. When we are in a recession, we typically see the year-over-year growth in personal income turn negative as many unfortunately lose their jobs or see their work hours cut.
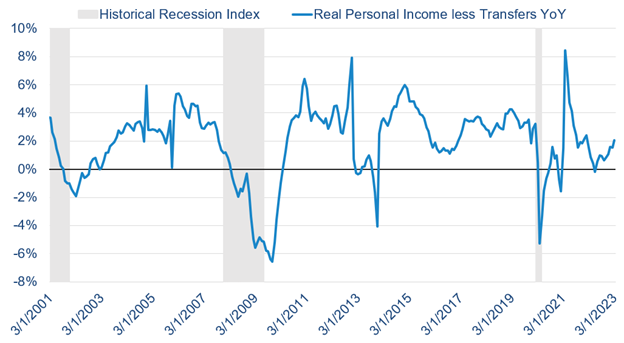
Source: The Federal Reserve Economic Database. Real Personal Income less Transfers year-over-year and Historical Recession Index. Monthly data as of March 2023.
The growth rate in personal income also flows through to consumer spending – a key driver of economic growth, as mentioned earlier. Consumer spending is lower than the pre-pandemic 5-year average of 2.6%, sitting at 2.0% for Q1 2023.
Although these indicators show weakening and cracks forming under the surface, like companies experiencing layoffs/hiring freezes and spending below the pre-pandemic 5-year average, the U.S. economy is still adding jobs, income growth is still positive, and spending is still positive. This is part of the reason why NBER has yet to announce a recession.
Recession Indicators: The Business and Production Side of the Economy
To measure the business and production side of the economy, NBER typically looks at U.S. production and wholesale trade. Industrial production looks at the output from the industrial sector of the economy: manufacturing, mining, and utilities. If industrial production is decreasing, then that means demand for manufactured goods and materials is decreasing. As of March 2023, the growth rate for industrial production stands around 0.5% and is trending down.
The growth rate for industrial production is on the verge of contracting
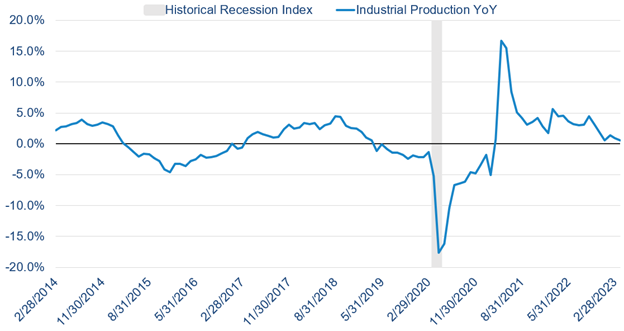
Source: YCharts and the Federal Reserve Economic Database. Industrial Production year-over-year and Historical Recession Index. Monthly data as of March 2023.
We can break down this broad-based industrial production number into major market groups: equipment, materials, consumer goods, and nonindustrial supplies. Under the hood, we find that the production of nonindustrial supplies and consumer goods is roughly flat or negative year-over-year, paralleling the slowing demand for these goods.
The growth in the production of consumers goods is flat over the last year
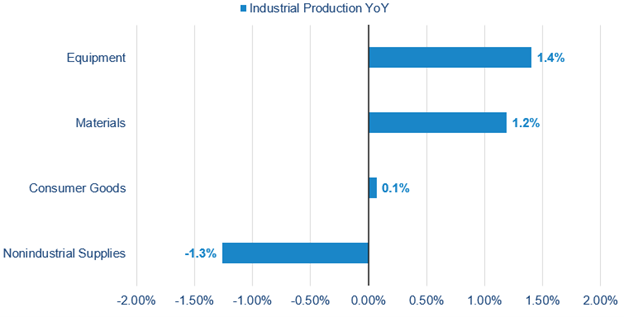
Source: YCharts. Industrial Production year-over-year. As of March 2023.
Wholesale sales, a tongue-twister of a term, refers to the sale of goods in bulk to retailers and tells a similar story. Purchases from retailers only increased by 1.26% over the last year. Retailers are seeing demand from the consumer start to drop – likely coinciding with the drop in spending and income growth.
Retailers are seeing less demand from consumers, leading wholesale sales to decline
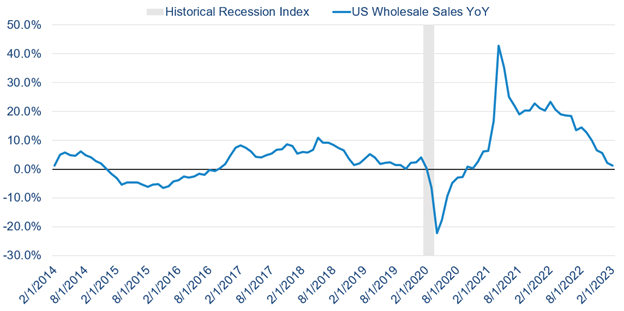
Source: YCharts and Federal Reserve Economic Database. US Wholesale Sales Year over Year and Historical Recession Index. Monthly data as of February 2023.
Pulling It All Together: What Do Recession Indicators Mean for the Economy?
Although recession risks are elevated and one could be in the near future, we are not in one quite yet. Typically, you will see leading indicators signal a recession first, then coincidence indicators while we are in the recession, and finally, lagging indicators near the end of the recession. It’s noteworthy that many leading indicators are signaling a recession for the US economy. The Conference Board’s Leading Economic Index – an index comprised of economic data that leads the economy by approximately 7 months (the stock market, manufacturing new orders, building permits, unemployment insurance claims, etc.) – is negative at -7.8% over the last year. Yet, numerous indicators that coincide or lag with the economy have yet to pull into contractionary territory (payrolls, household employment surveys, income, spending, and industrial production). This is likely the reason why the NBER hasn’t announced a recession even though one is expected soon. Ultimately the recession won’t send the stock market into a dark abyss forever as stocks historically rebound. Recessions are also a great time to hold bonds, as bond yields fall and prices rise.
How To Prepare for a Recession
It’s important to stay invested through a recession as the first few days, when the stock market rebounds and bond yields drop, tend to have some of the largest daily returns. Also, make sure that you have proper liquidity and emergency reserves in place for a recession. A financial plan can help you determine the amount you need in reserves and whether you have enough liquidity, which is critical to enduring the emotional rollercoaster that investing can be. It allows you to sleep at night knowing that fluctuation in the stock or bond market won’t negatively impact your quality of life. Please reach out to your advisor if you have any questions or don’t yet have a financial plan to help you stay invested.
Important Disclosures: The information provided here is of a general nature and is not intended to answer any individual’s financial questions. Do not rely on information presented herein to address your individual financial concerns. Your receipt of information from this material does not create a client relationship and the financial privileges inherent therein. If you have a financial question, you should consult an experienced financial advisor. Moreover, the hiring of a financial advisor is an important decision that should not be based solely upon blogs, articles, or advertisements. Before you hire a financial advisor, you should request information about the financial advisor’s qualifications and experiences. Past performance is no guarantee of future results. All expressions of opinion are subject to change without notice in reaction to shifting market conditions. Data contained herein from third party providers is obtained from what are considered reliable sources. However, its accuracy, completeness or reliability cannot be guaranteed. Examples provided are for illustrative (or “informational”) purposes only and not intended to be reflective of results you can expect to achieve. AllGen Financial Advisors, Inc. (AllGen) is an investment advisor registered with the SEC. AllGen does not provide personal financial advice via this material. The purpose of this material is limited to the dissemination of general information regarding the services offered by AllGen. The Disclosure Brochure, Form ADV Part II, which details business practices, services offered, and related fees of AllGen, is available upon request.


