Read through our market commentary here, or skip to Jason’s October 2022 Market Update video below.
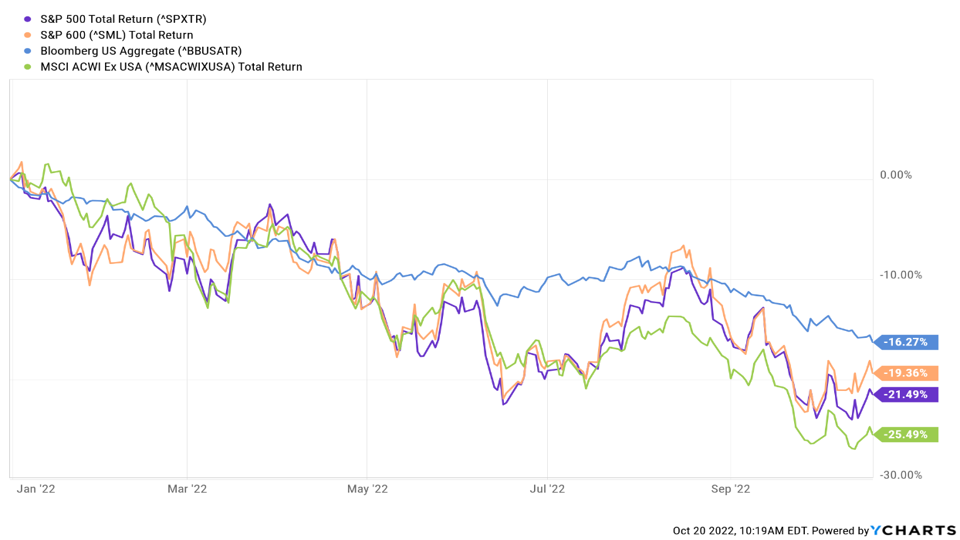
2022 has continued to be a very difficult year for investors as the Fed continues to aggressively raise interest rates in efforts to slow down the economy and reduce inflation. Bonds are currently experiencing their worst drawdown on record however, they are still managing to outperform stocks. Both stocks and bonds have taken large losses this year making investors feel like there’s nowhere to hide. The chart below illustrates the 2022 performance of large-cap, mid-cap, and small-cap stocks, international stocks, and bonds. All of which are down over -16% for 2022!
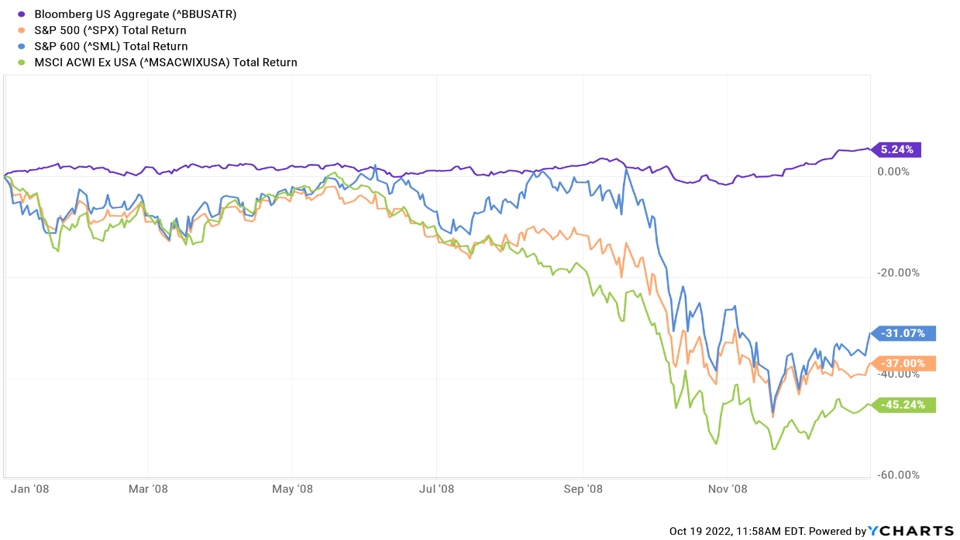
Historically, bonds have offered decent protection when stocks struggle like in 2008 when large-cap stocks, small-cap stocks, and international stocks fell -37%, -31%, and -45% respectively, bonds offered solid diversification and rose 5.2% (see chart below).
We are big believers in maintaining portfolios with non-correlated assets meaning, holding assets that don’t always move in the same direction. 2022 has been a unique year in that nearly all asset classes have been highly correlated meaning, they are moving down together.
Investment Opportunities in Bonds
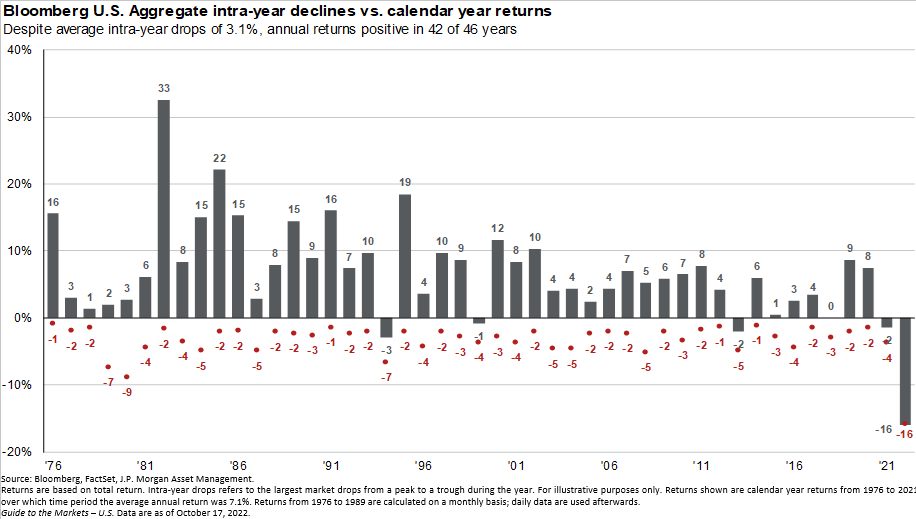
As mentioned, the bond market is currently experiencing its worst drawdown in recorded history. Over the last 50 years, we plot the calendar year return (gray bar), and the intra-year drop (red dots). Before 2022, the largest calendar-year drop in the entire bond market was -3% in the early ‘90s whereas today, bonds are down much lower at -16% YTD for 2022.
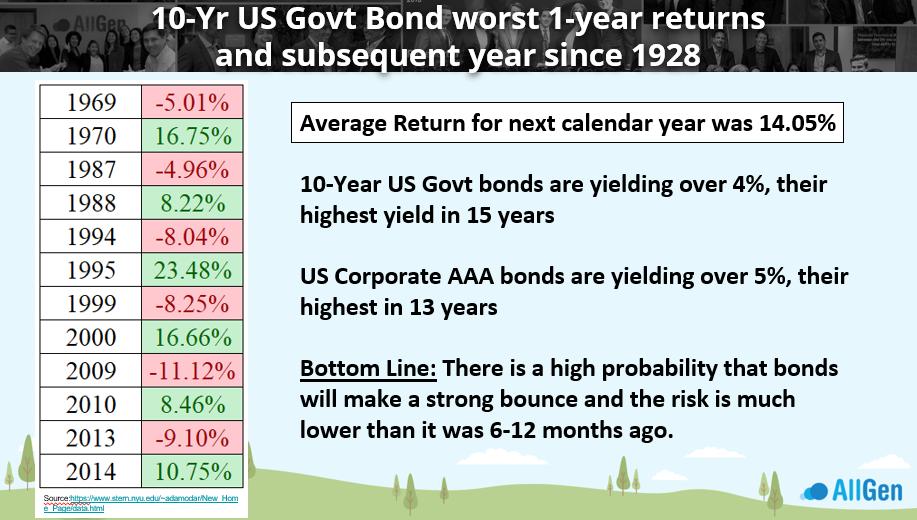
Historically, the year following bad bond markets has typically seen above-average positive returns. In the below diagram, we focus on 10-year government bonds, specifically only on bad calendar years and the immediately following calendar year. In 1969 bonds were down -5% then, +16.75% in 1970. In 1994 bonds fell -8.04% and in 1995 returned 23.48%. Historically, the average return for 10-year government bonds in the calendar year immediately following a major loss is 14.05%! It’s also important to remember that bond yields move inversely to price and now that bond prices have declined as much as they have, bond yields are reaching decade highs. Although it can be scary to invest in something after it’s declined so much in value, history has shown that major drawdowns usually hint at opportunity!
A Difficult Year for Conservative Allocations
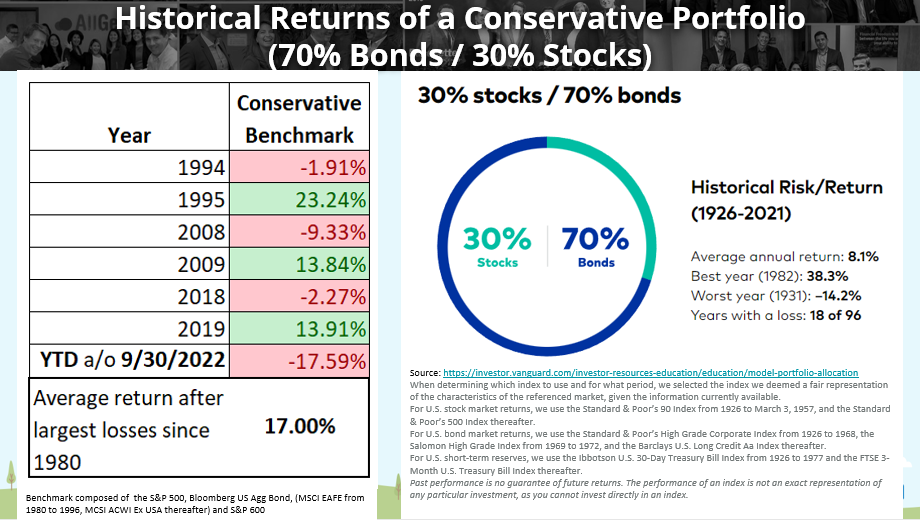
AllGen’s conservative benchmark is a passive allocation of 70% bonds and 30% stocks, composed of the main total market indexes (large-cap stock, small/mid-cap stock, international stock, and bonds). Obviously, conservative investment strategies are going through tough times in 2022, given recent losses in bonds and the fact that conservative accounts are mostly made up of bonds. Earlier, we discussed how the bond market typically has above-average performance after significant declines, and the same methodology is true for diversified benchmark indexes. When analyzing the conservative benchmark since the 1920s, the worst calendar year was 1931 (Great Depression era) at -14.2%. 2022 is on track to be even worse at -17.59% year-to-date as of 9/30/2022. Looking back since 1980, the conservative benchmark returned an average of 17% in the calendar year immediately following a major drop (see diagram below).
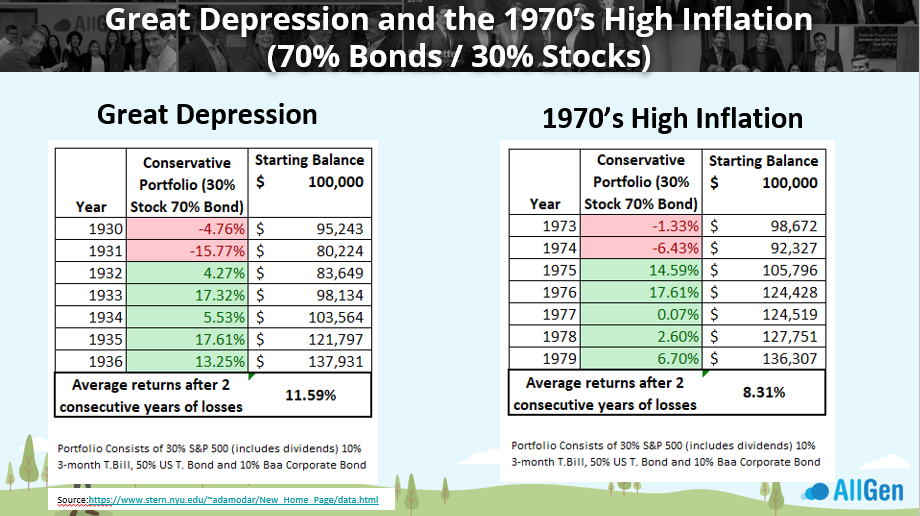
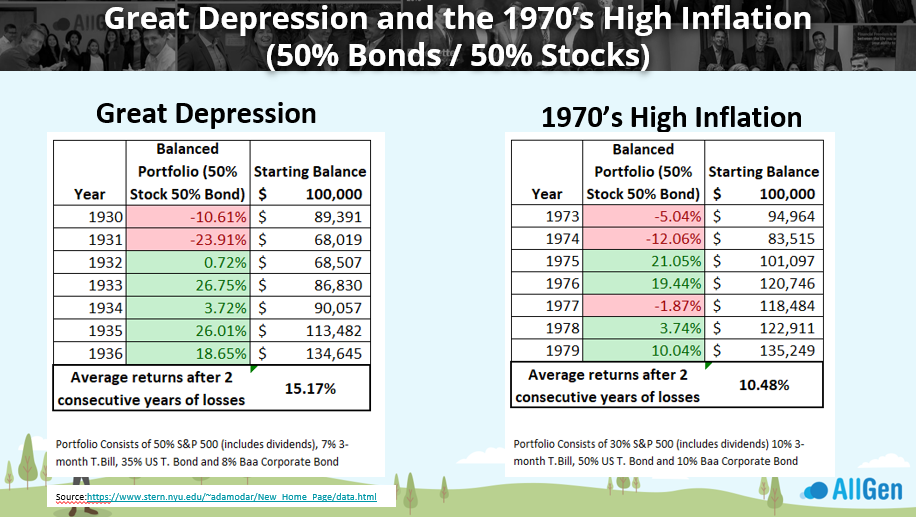
In the following diagram we analyze the conservative benchmark during two similar high-inflation environments; the great depression in the early 1930s and the 1970s. Both time periods produced two consecutive years of negative returns but, in the 5 years following the great depression and the 1970s, the average annual return of the conservative benchmark was 11.59% and 8.31% respectively!
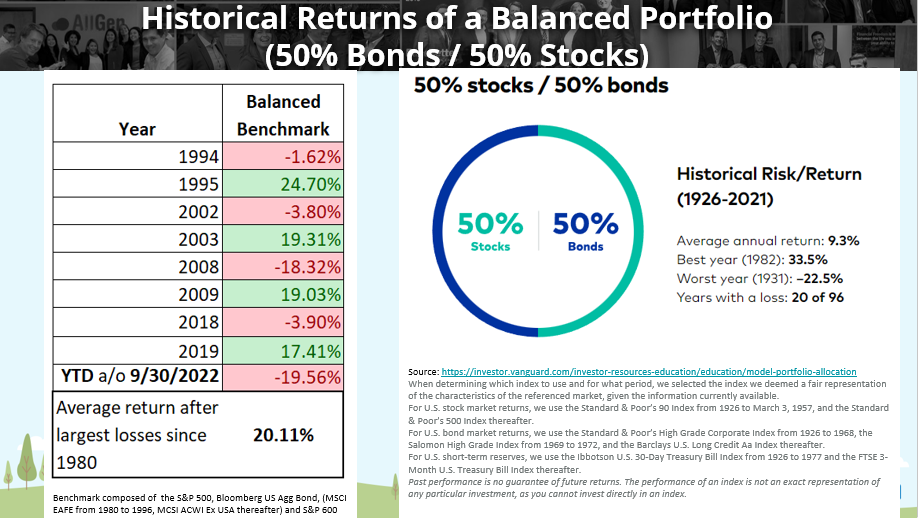
Similarly, the balanced benchmark takes the same total market indexes of large-cap stock, small/mid-cap stock, international stock, and bonds, except it’s weighted 50% bonds and 50% stock. As of 9/30/2022, the YTD returns for the balanced benchmark are down -19.56%, nearly its all-time worst calendar year since 1931. Applying the same logic we discussed earlier using the conservative benchmark, in the diagrams below we see that years following very bad returns are typically above average.
Although it may not feel like we’re entering a recession yet, markets tend to anticipate recessions and largely decline long before a recession is actually called. Understanding that markets anticipate the future and studying historical market drawdowns can help the investor properly position a portfolio and take advantage of opportunities in markets. It’s crucial to keep this concept in mind when investing as the news could continue to get worse, the economy could continue to get worse, but returns in stock and bond markets could get better!
Gains, Losses, and Income How to Protect Your Accounts
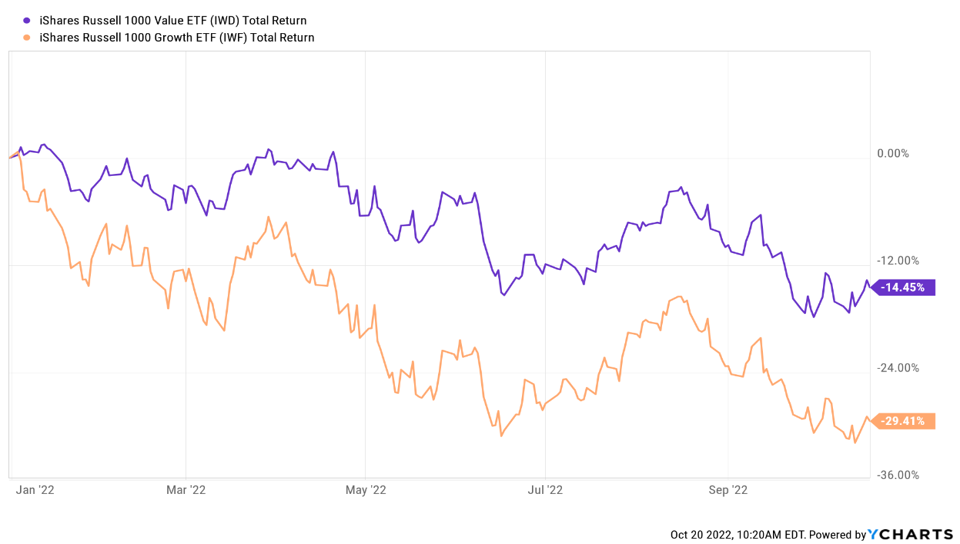
This isn’t the first market commentary where we mention the relationship between value stocks vs. growth stocks. Value stocks represent stronger balance sheets and dividend-paying stocks whereas growth represents more technology, non-dividend-paying stocks. Value stocks are down -14.45% year-to-date as of 9/30/2022 vs. Growth stocks at -29.41%. Although -14.45% seems bad, a portfolio going into 2022 overweight growth stocks would be much worse off than a portfolio overweight value stocks. In late 2021, we saw that growth stocks were becoming incredibly overvalued which prompted us to favor value stocks heading into 2022 which has helped protect accounts.
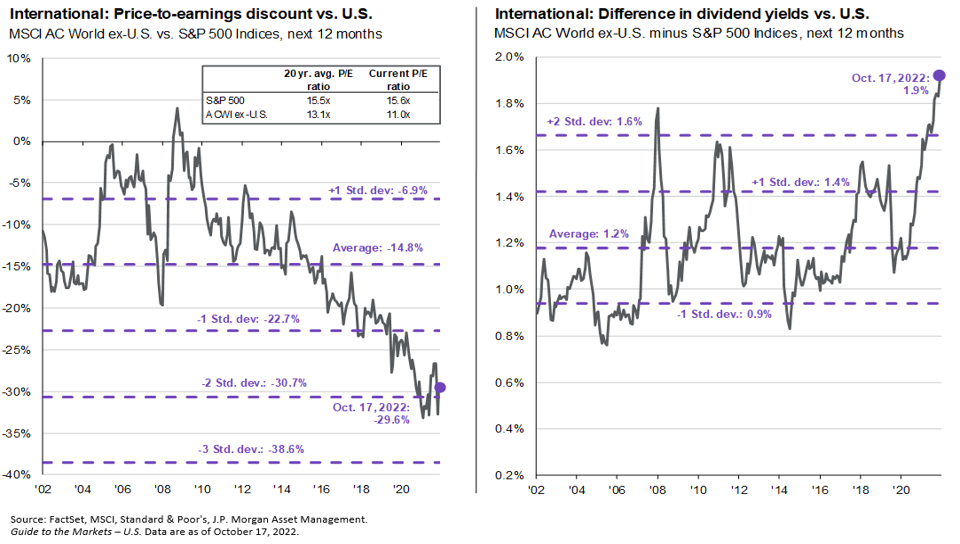
International stocks are another area we’re optimistic about given their historically low valuations and high dividend yield when compared to US stocks. Favoring international stocks has been slow to pay off however, the data in the below chart continues to show compelling potential opportunities. Timing the market is nearly impossible, even for professional money managers, but data like we see in the charts below have historically precluded massive rallies.
Market Sentiment and Investment Opportunities
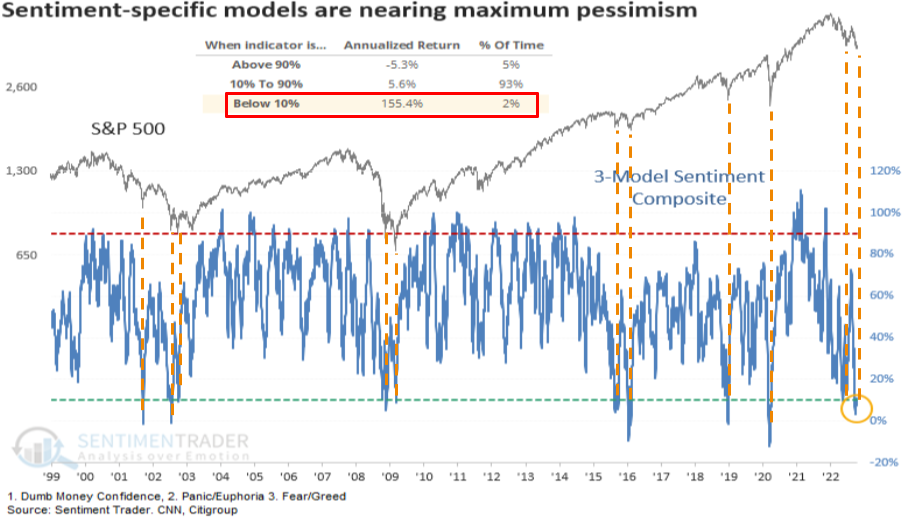
Market sentiment is a metric that is closely monitored by professional money managers and while seemingly contradictory, extremely bad market sentiment usually indicates great buying opportunities. See the chart below where we combine 3 major sentiment indicators into one. Each vertical dotted orange line represents a time of extremely low market sentiment, which usually aligns with market bottoms in the S&P 500. Markets have only seen this level of pessimism less than 2% of the time and while it sounds crazy, the average annualized return in the S&P 500, when this indicator is below 10%, is 155.4%! While It’s nearly impossible to time market bottoms, and we could very well see things get worse, for the time being, events like these are sobering reminders that the time to act on opportunity usually happens at the scariest of times.
AllGen actively manages portfolios on the behalf of clients. For more information on how portfolios are managed, talk to an advisor here!
For more information, watch the full October 2022 Market Update video below.
Important Disclosures: The information provided here is of a general nature and is not intended to answer any individual’s financial questions. Do not rely on information presented herein to address your individual financial concerns. Your receipt of information from this material does not create a client relationship and the financial privileges inherent therein. If you have a financial question, you should consult an experienced financial advisor. Moreover, the hiring of a financial advisor is an important decision that should not be based solely upon blogs, articles, or advertisements. Before you hire a financial advisor, you should request information about the financial advisor’s qualifications and experiences. Past performance is no guarantee of future results. All expressions of opinion are subject to change without notice in reaction to shifting market conditions. Data contained herein from third party providers is obtained from what are considered reliable sources. However, its accuracy, completeness or reliability cannot be guaranteed. Examples provided are for illustrative (or “informational”) purposes only and not intended to be reflective of results you can expect to achieve. AllGen Financial Advisors, Inc. (AllGen) is an investment advisor registered with the SEC. AllGen does not provide personal financial advice via this material. The purpose of this material is limited to the dissemination of general information regarding the services offered by AllGen. The Disclosure Brochure, Form ADV Part II, which details business practices, services offered, and related fees of AllGen, is available upon request.


