Read through our market commentary here, or skip to Jason’s May 2022 Market Update video below.
Volatility in Markets: What Can We Learn?
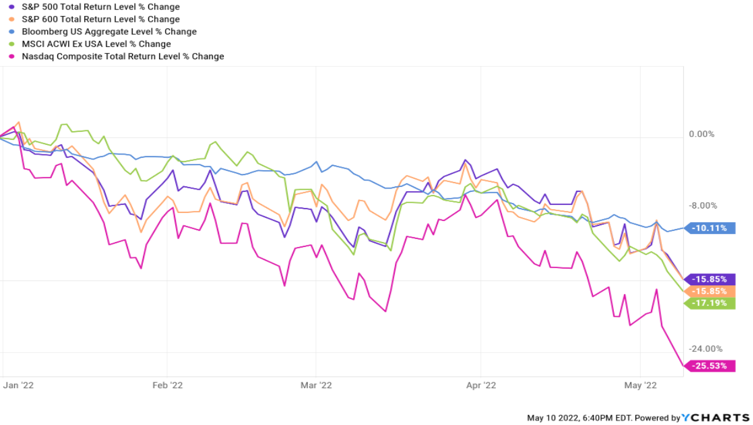
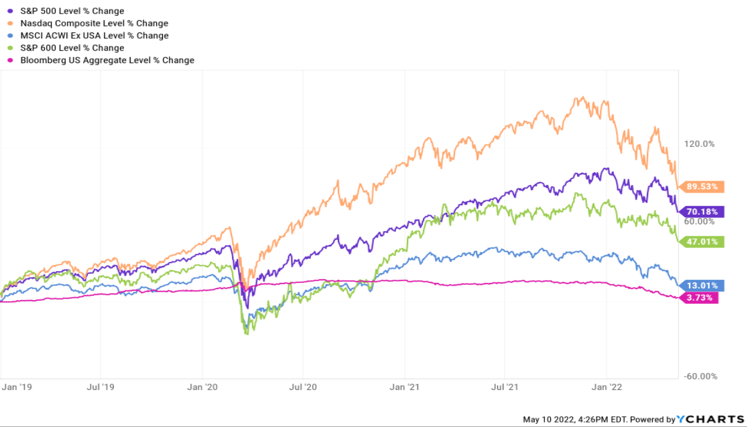
2022 continues to be a tough year for most market sectors. As of 5/10/2022, the S&P 500 (Large Cap), S&P 600 (Small Cap), and MSCI ACWI Ex US (International) are down -15.85%, -15.85%, and -17.19% respectively, with bonds returning -10.11% (see first chart below). As the Fed attempts to aggressively raise interest rates to combat inflation, investors fear that raising interest rates too fast could send the economy into recession. Despite negative returns across most sectors for 2022, it’s important to remember how far we’ve come. In the second chart, we view the same sectors but over the last 3 and a half years and can see that these same three sectors are up significantly. From 1/1/2019 to 5/10/2022, the S&P 500, S&P 600 (small cap) and MSCI ACWI Ex US (International) are up 70.18%, 47.01%, and 13.01% respectively. When markets have strong bull runs, people can become accustomed to high returns, which makes recent negative returns look even uglier. After the 2020 recession following the Covid-19 pandemic, the stock market’s rather immediate recovery was largely due to extreme amounts of stimulus (money printing and rate cuts) in government efforts to cushion the blow of a global shutdown. Now that that stimulus is gone and even being reversed, it can cause economies to weaken.
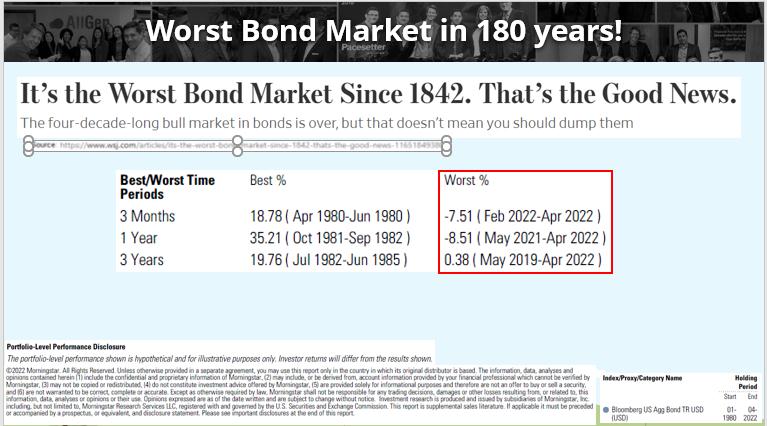
Worst Bond Market Since 1842. That’s the Good News.
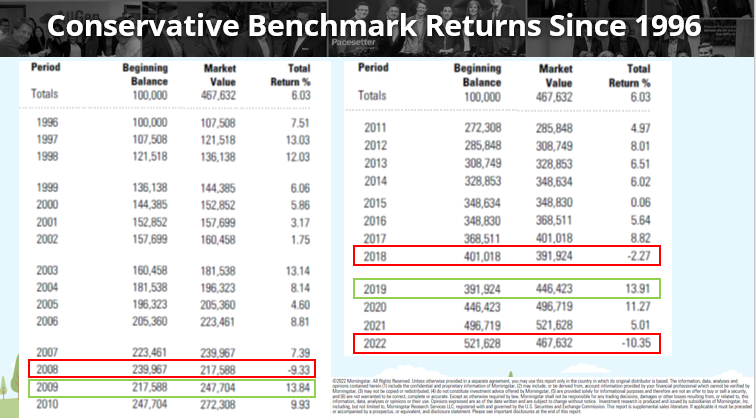
Focusing on bonds, since 1980 we are currently going through the worst drawdown for bonds and sourced from the WSJ, the worst calendar year return since 1842. While this statement certainly is concerning, the good news is that bad years have historically been good opportunities for investors. When examining a conservative benchmark (which is made up of 70% bonds) since 1995 some of the best returns came the very next year following negative returns (see the second table below).
Overweighting Value
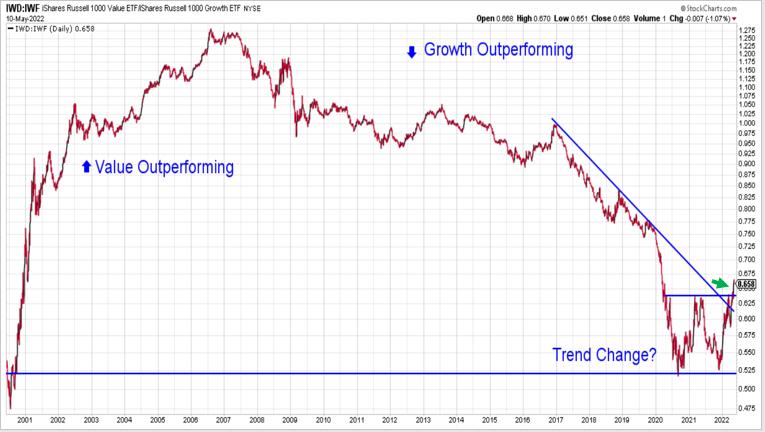
The chart below illustrates the relationship between value stocks and growth stocks. Growth stocks represent companies with high valuations with high growth rates such as Amazon, Google, and Apple, whereas value stocks represent companies with lower valuations like CVS, Walmart, and Procter and Gamble. When the line is increasing, value stocks are outperforming and when the line is decreasing, growth stocks are outperforming. Over the last two years, we have been monitoring this “trend change” indicating that value stocks may outperform going forward. We have been favoring value stocks in the AllGen portfolios during this time. As indicated by the green arrow, the indicator has broken two significant resistance levels which suggests the trend has changed.
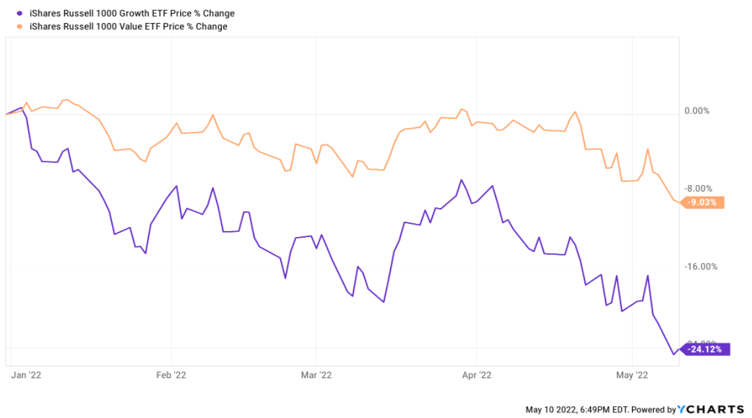
When comparing the Russell Growth and Value index for 2022, we can see that while growth stocks are down -24.12%, Value stocks are only down -9.03% as of 5/10/2022 which is a big difference and supports the notion that diversifying across sectors and equity styles can help cushion market volatility.
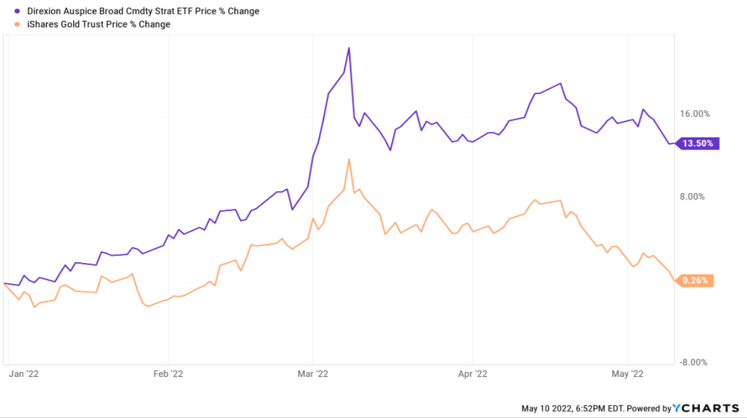
We have also been favoring asset classes that tend to do better during high inflation and uncertain economic times such as commodities and gold. As we entered 2021 we’ve added to the Direxion Auspice Broad Commodity Strategy (COM), which is an ETF that invests in a basket of trending commodities. Since the beginning of 2022 and as of 5/10/2022, COM is up 13.5%, which has helped our portfolios. Gold is another asset we’ve added back into the portfolio which should hold up better if inflation continues to remain elevated.
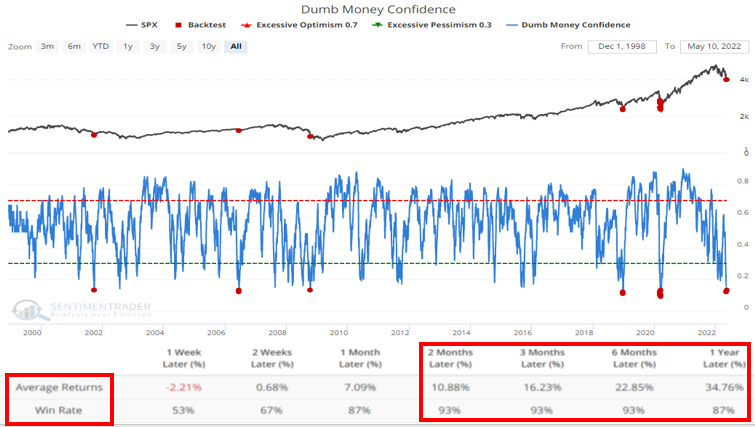
Pessimism Is at Historical Highs
Dumb Money confidence spread, published by Sentimenttrader.com, measures the sentiment of the average investor, currently reading historical lows. The theory is that the average investor is typically wrong (especially at extremes). We can test this by charting the Dumb Money Confidence indicator and comparing it against the S&P 500. Recording when the indicator fell to historic lows (where we are now), we can track the subsequent returns of the S&P 500 and collect probabilities and averages. Looking at the red box in the chart below, we can see that historically when the indicator reached this level there were high probabilities (win rates) that the S&P 500 returned double digits between two and twelve months later. Clearly, this doesn’t happen 100% of the time, however, it does mean that on average, times of extremely high pessimism have historically produced incredible buying opportunities for investors. During uncertain times in markets, it is important to stay disciplined when it comes to investing and to always consult with your advisor when considering changing your investment strategies.
For more information, watch the full May 2022 Market Update video below.
Important Disclosures: The information provided here is of a general nature and is not intended to answer any individual’s financial questions. Do not rely on information presented herein to address your individual financial concerns. Your receipt of information from this material does not create a client relationship and the financial privileges inherent therein. If you have a financial question, you should consult an experienced financial advisor. Moreover, the hiring of a financial advisor is an important decision that should not be based solely upon blogs, articles, or advertisements. Before you hire a financial advisor, you should request information about the financial advisor’s qualifications and experiences. Past performance is no guarantee of future results. All expressions of opinion are subject to change without notice in reaction to shifting market conditions. Data contained herein from third party providers is obtained from what are considered reliable sources. However, its accuracy, completeness or reliability cannot be guaranteed. Examples provided are for illustrative (or “informational”) purposes only and not intended to be reflective of results you can expect to achieve. AllGen Financial Advisors, Inc. (AllGen) is an investment advisor registered with the SEC. AllGen does not provide personal financial advice via this material. The purpose of this material is limited to the dissemination of general information regarding the services offered by AllGen. The Disclosure Brochure, Form ADV Part II, which details business practices, services offered, and related fees of AllGen, is available upon request.


