What Is Dollar Cost Averaging?
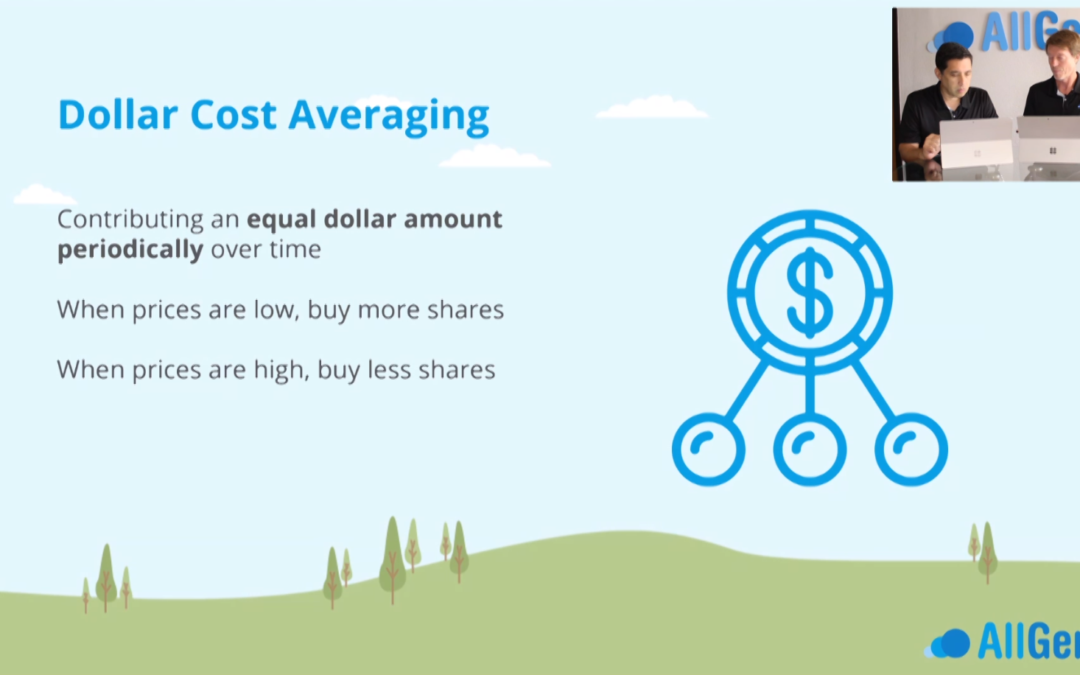
Dollar cost averaging is another strategy in investing where investors contribute an equal dollar amount periodically into their investment accounts over time. The outcome of this strategy is:
- When prices are low, the contribution buys more shares
- When prices are high, the contribution buys less shares
Keep reading this blog or skip to our dollar cost averaging video below from AllGen Academy.
How Does Dollar Cost Averaging Work?
For example, an investor buys $100 worth of XYZ mutual fund at the first of every month for 3 months.
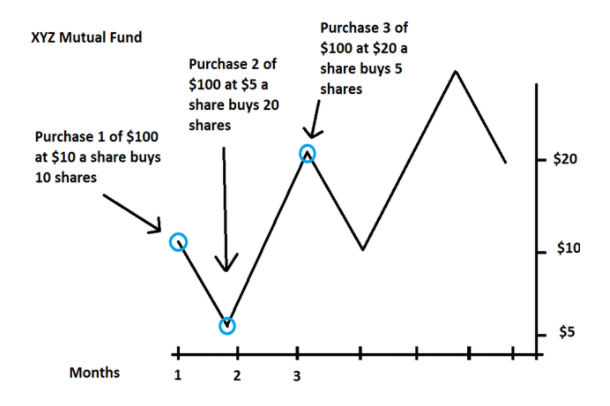
Month 1: The $100 is invested in XYZ mutual fund at $10 a share and 10 shares were purchased ($100 divided by $10 share price).
Month 2: The $100 is invested into XYZ mutual fund at $5 a share and 20 shares were purchased ($100 divided by $5 share price).
Month 3: The $100 is invested in XYZ mutual fund at $20 a share and 5 shares were purchased ($100 divided by $20 share price).
At the end of 3 months, the investor invested a total of $300 and owns 35 shares. At $20 a share, the total value is $700. This represents a 133% gain with the dollar cost averaged shares while XYZ fund only went up 100% during that 3 month time period from its original price of $10 a share.
If the fund went back down to $10 a share in month 4, the $300 investment would be worth $350 (yielding a $50 gain) even though the fund is at the same price as month 1.
The beauty of dollar cost averaging is that you can buy more shares when the investment price is low and less shares when the price is high.
The following two charts show the performance of an investment in the S&P 500 during the exact same time frame (9/5/2000 through 11/1/2011). During this time frame, the market between start and finish was flat: the S&P 500 had an annualized return of -0.03%.
Example with No Dollar Cost Averaging
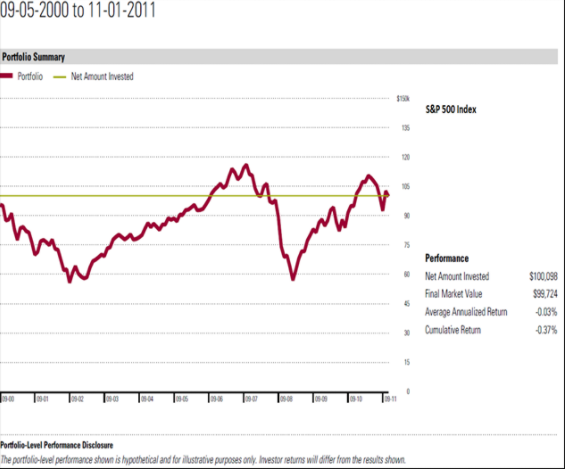
Investing a lump sum of $100,000 at the beginning would be about the same after 11 years.
Example with Dollar Cost Averaging
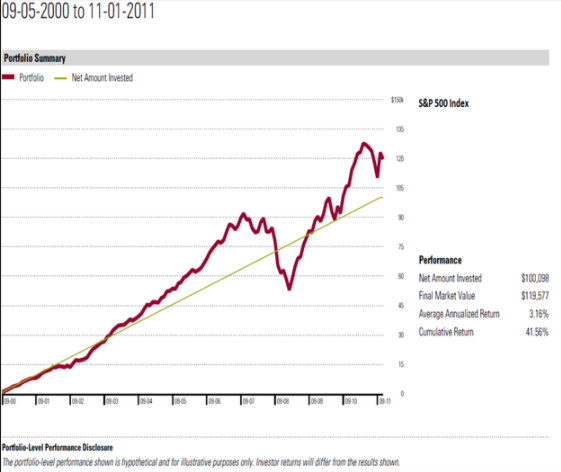
However, if an investor decided not to invest the whole $100,000 all at the front but invested an equal dollar amount each month over the 11-year period instead, the investor would end up with a gain of over 41.6% or 3% annualized. The dollar cost averaged investment would be worth $120,000 after the same period while the S&P 500 had no gains.
It’s important to note that dollar cost averaging doesn’t always work better than investing a lump sum.
- In a weak market, dollar cost averaging works better
- In a strong market, lump sum investing works better
We don’t advocate trying to time the market but disciplined consistent periodic investment is a great way to build wealth.
Ways to Implement Dollar Cost Averaging
- 401(k) – invest a percentage of your salary every paycheck to employer-sponsored retirement account
- IRAs or taxable accounts – set up monthly recurring contributions
The key is to stick with it over time, especially when the market is down. Remember that is your opportunity to buy more shares with the same dollar amount and improve your long-term returns.
![]()
For more information on dollar cost averaging, watch our video from AllGen Academy below.
Important Disclosures: The information provided here is of a general nature and is not intended to answer any individual’s financial questions. Do not rely on information presented herein to address your individual financial concerns. Your receipt of information from this material does not create a client relationship and the financial privileges inherent therein. If you have a financial question, you should consult an experienced financial advisor. Moreover, the hiring of a financial advisor is an important decision that should not be based solely upon blogs, articles, or advertisements. Before you hire a financial advisor, you should request information about the financial advisor’s qualifications and experiences. Past performance is no guarantee of future results. All expressions of opinion are subject to change without notice in reaction to shifting market conditions. Data contained herein from third party providers is obtained from what are considered reliable sources. However, its accuracy, completeness or reliability cannot be guaranteed. Examples provided are for illustrative (or “informational”) purposes only and not intended to be reflective of results you can expect to achieve. AllGen Financial Advisors, Inc. (AllGen) is an investment advisor registered with the SEC. AllGen does not provide personal financial advice via this material. The purpose of this material is limited to the dissemination of general information regarding the services offered by AllGen. The Disclosure Brochure, Form ADV Part II, which details business practices, services offered, and related fees of AllGen, is available upon request.


