Read through our market commentary here, or skip to Jason’s February 2022 Market Update video below.
The Russia-Ukraine Conflict
While the Russia-Ukraine conflict is creating a lot of fear in markets, its impact on the economy in terms of market exposure is negligible. Russia makes up only 3% of the emerging markets index and 0.4% in the ACWI (All Country World Index). Even though the chances of this conflict escalating into World War III are low, it’s important to look at what could be a worst-case scenario with the market.
Historical Comparisons
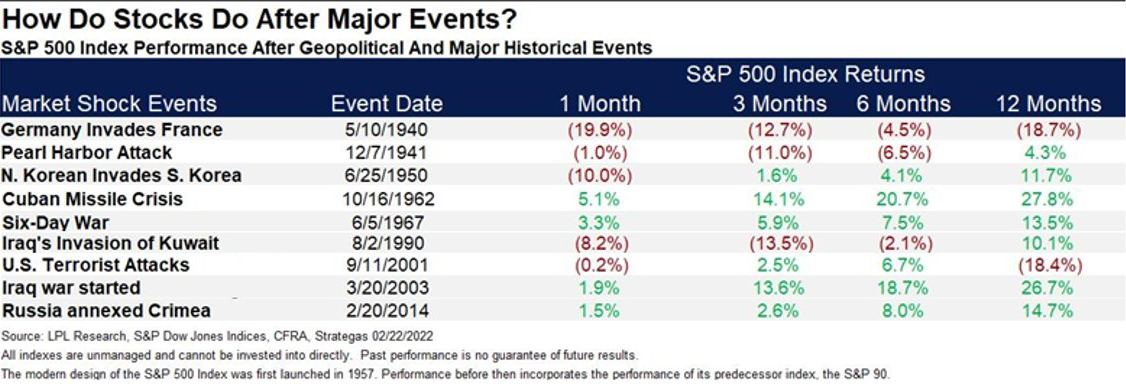
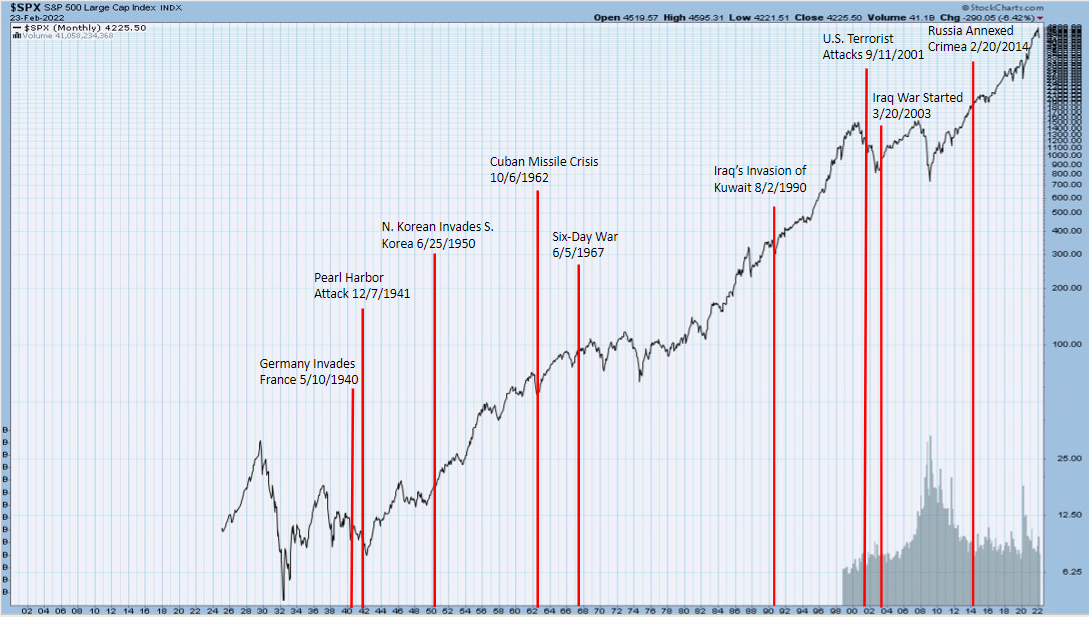
For comparison, we can look at historical geopolitical events and compare how markets reacted to get a sense of what could happen with the Russia-Ukraine conflict. Out of nine conflicts considered to be similar to the Russia Ukraine invasion outlined in the table, the S&P 500 ended the next twelve months positive seven out of the nine times. Six out of these seven times, the S&P 500 had double-digit returns.
Historically, markets have dropped in the first month after a major conflict began, but then recovered in the months following. Using this research, we can study how markets have performed historically to events of a similar scale to help us make better investment decisions going forward.
Oil Prices
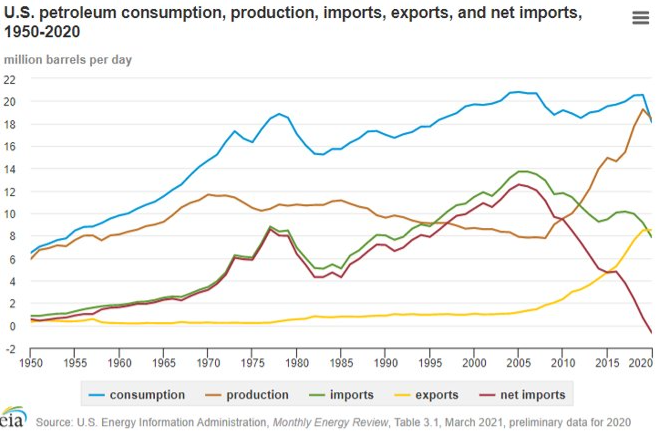
Another factor of the Russia-Ukraine conflict is oil prices, given most of Europe is dependent on Russian oil and gas imports. It’s important to look at both oil consumption and production. In 2020, the United States produced 18.4 million barrels of oil, but only consumed 18.1 to 18.2 million barrels. The United States has become the largest oil producer in the world due to advancing technologies that have made oil extraction more efficient. This offers the US oil economy protection against rising oil prices coming out of Russia and Europe.
Diversified Portfolios
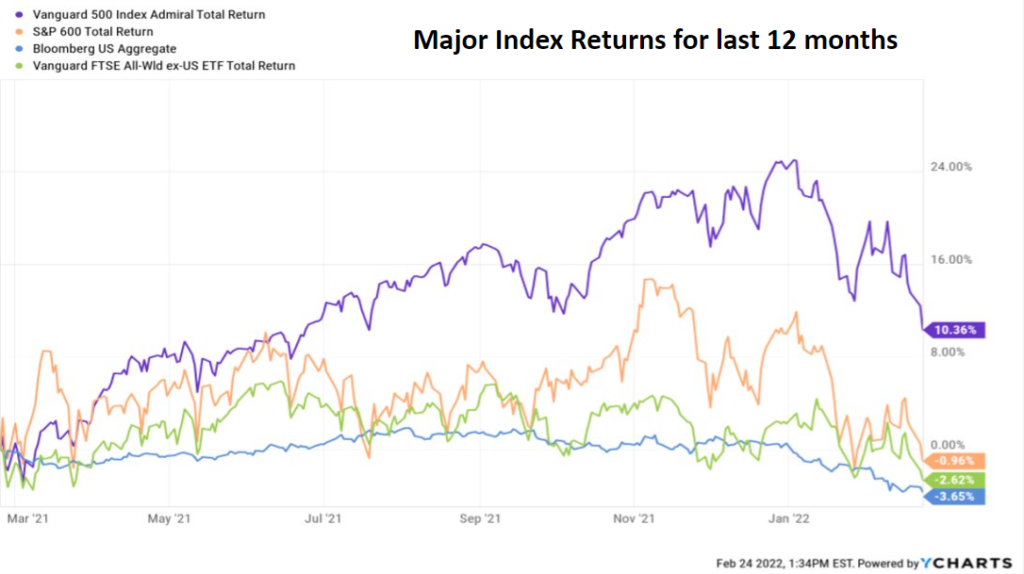
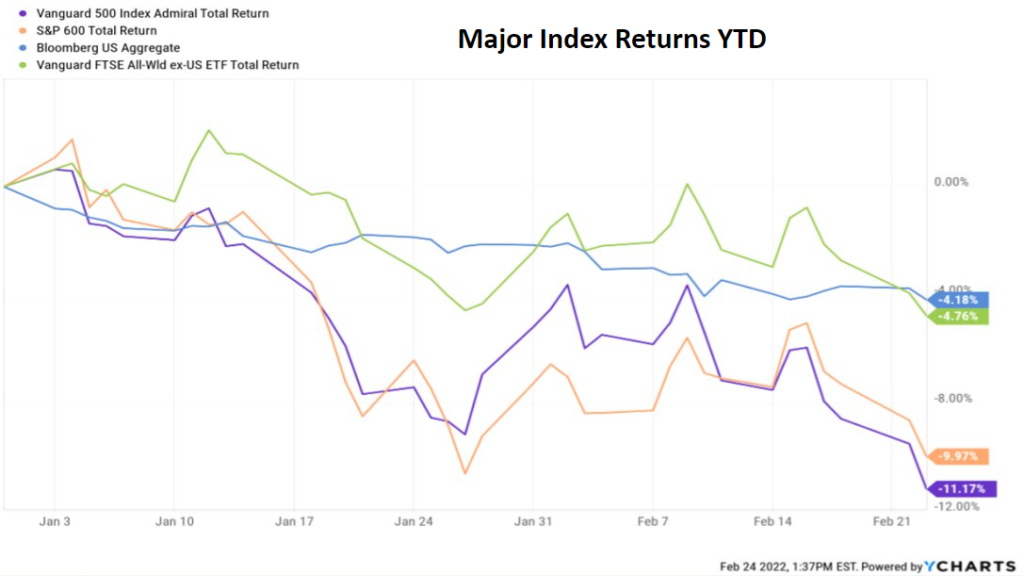
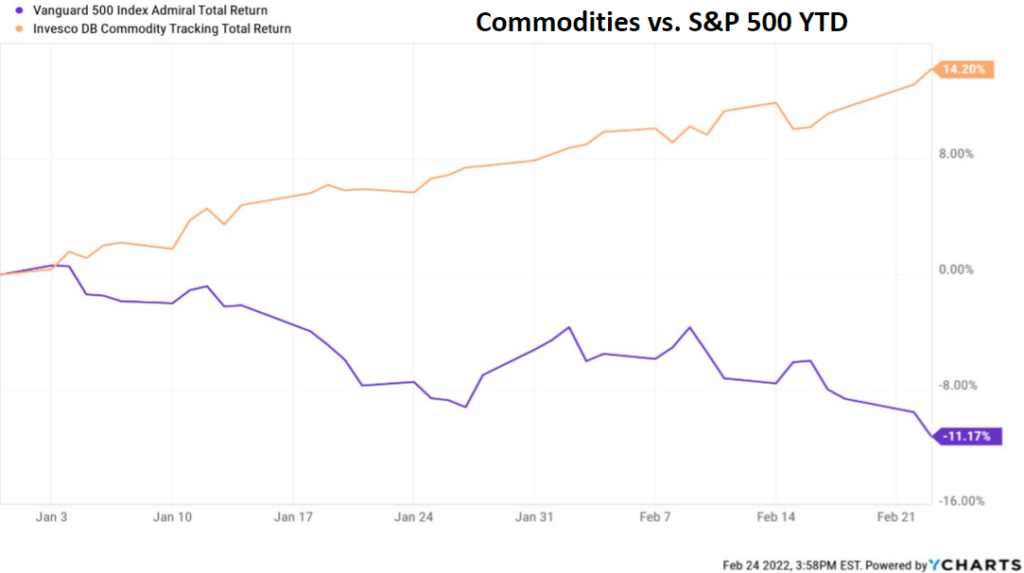
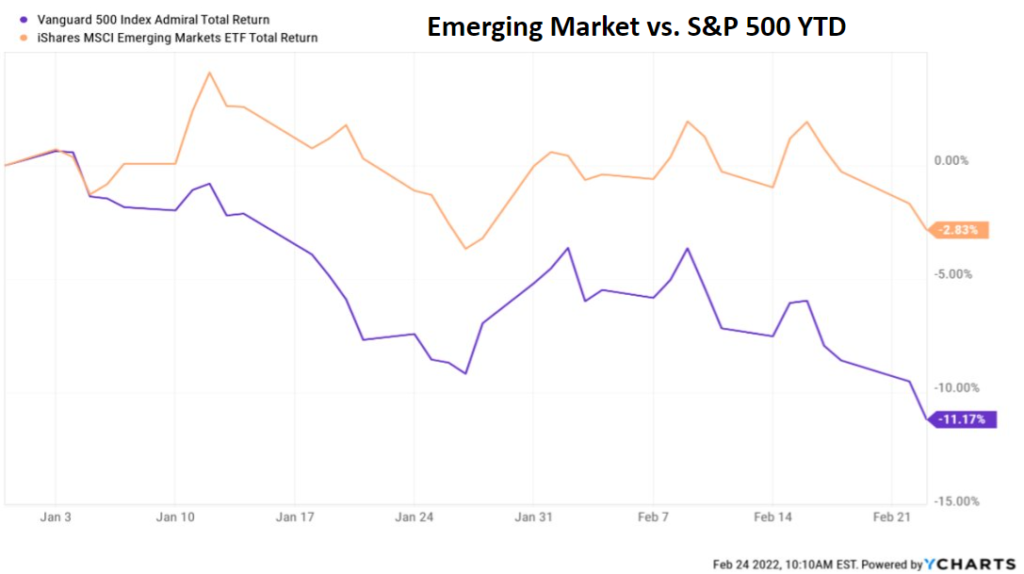
In the last twelve months, only one major index, the S&P 500, was positive as of 2/24/2022. However, during January and February of 2022, the S&P 500 was the worst-performing sector at -11.17%, where emerging markets and commodities performed best at -2.83% and +14.20% respectively. In the past five years, 2018 was the only down year causing many investors to have grown accustomed to double-digit annual returns and now expect them every year, but that’s not normal or sustainable for markets. Over the long term, there are good years and bad years and the average is closer to 10% annual return, not the 20% annual return we’ve seen in the past few years. Additionally, the S&P 500 has been strong over the past 10 years, but prior to that, it was international stocks and US small caps that outperformed. Markets often favor different sectors over a ten-year period in pendulum shifts. A diversified portfolio can help investors weather these market changes much better because when one index is underperforming, another could be outperforming. It’s important to look at the markets over time and not just at what is currently outperforming.
High Fear Environments
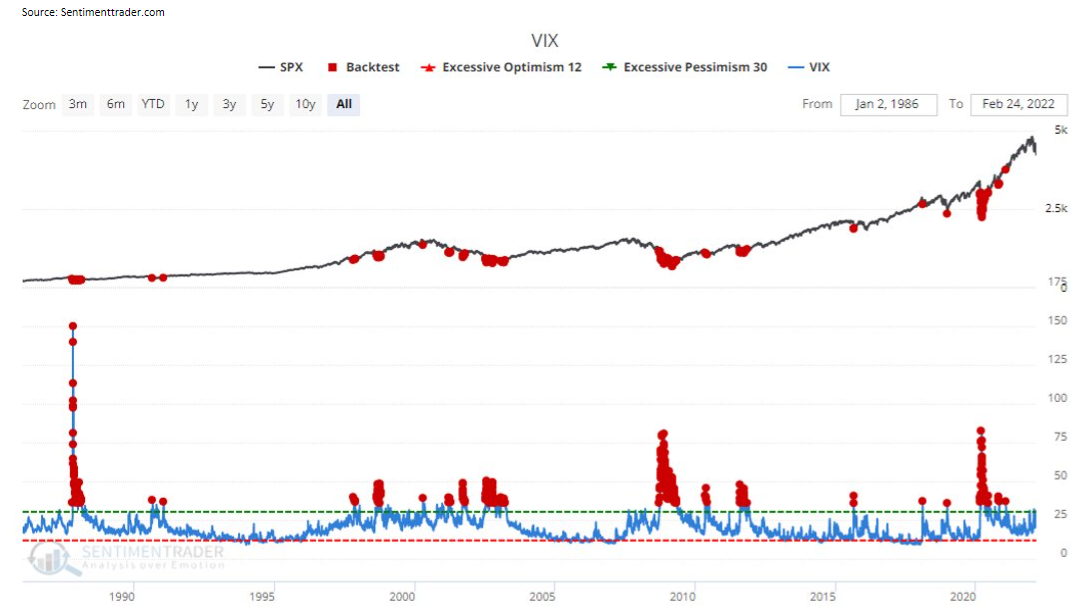
It may seem counterintuitive, but a high-fear environment, like the beginning of a conflict, can actually be a good time to put more money into investments. The VIX measures market volatility. Nicknamed “The Fear Index,” upward spikes mean market volatility is increasing. As you can see in the chart, when the VIX (blue line) has spiked, it has usually been a good time to invest in markets, despite the fear that might be circulating in the news.
Since the 1980s, every time the VIX has reached above the level of 36, markets have seen positive returns over the next 12 months 94% of the time, with an average return of 25.57%. Historically, markets have mostly recovered not long after periods of increased volatility.
Interest Rate Hikes
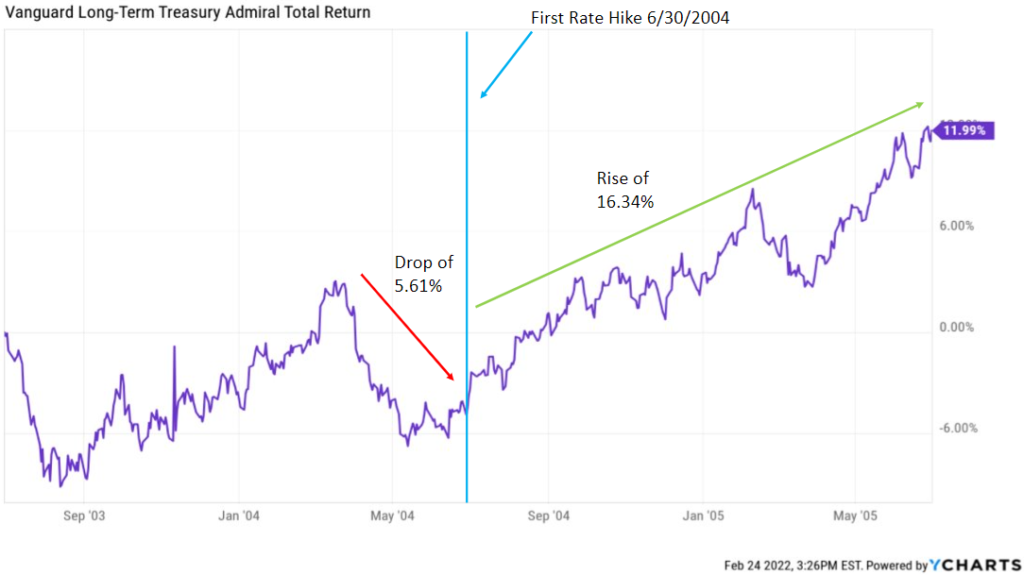
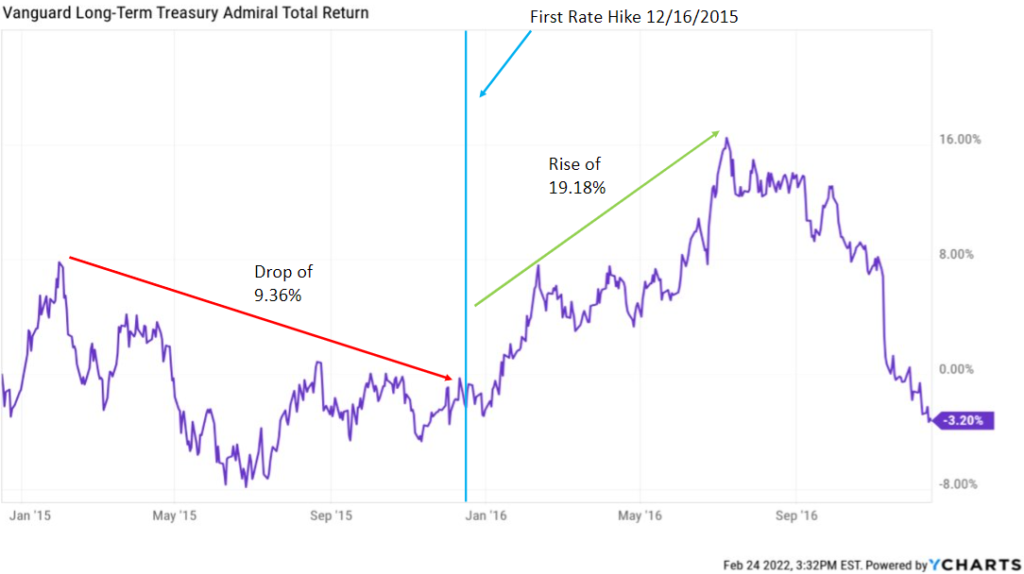
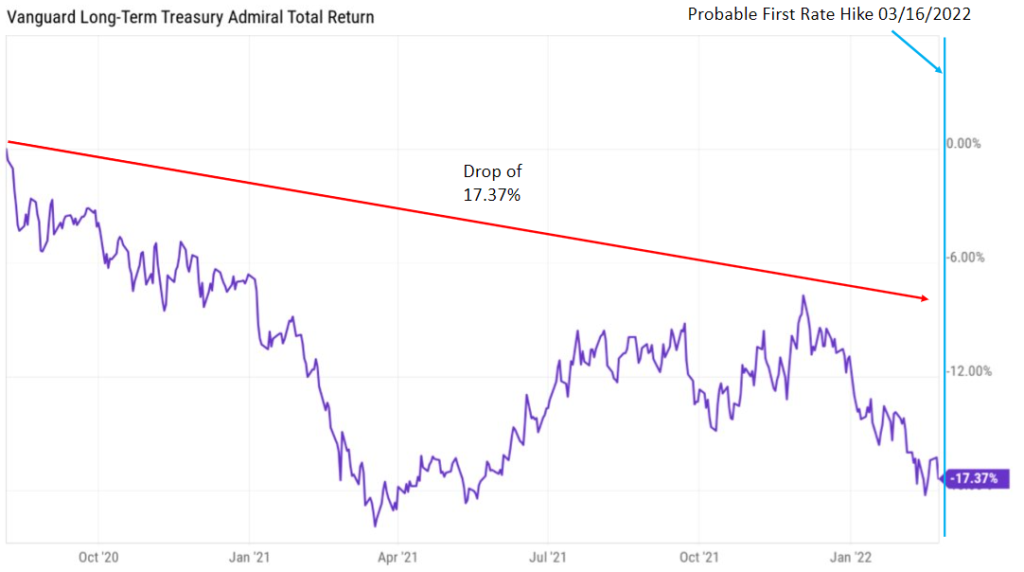
Bond prices have an inverse relationship with interest rates. When interest rates rise, bond prices decrease. However, the timing of this relationship between prices and interest rates doesn’t usually happen when people expect it. Just like stock markets and other markets, bond markets try to anticipate the future. Because of this anticipation of the future, when interest rate hikes occur like they are thought to in mid-March, bond markets don’t necessarily go down immediately but rather before the rate hike. In fact, historically, bond prices have risen after the rate hike. See the charts: the vertical blue line indicates exactly when the Fed began raising interest rates during several historical time frames. Bond prices tend to go down anticipating the coming rise in rates (before the blue line), but when the rate hike actually happens (at the blue line), prices tend to go up after.
This means that buying bonds before, or at, an interest rate hike can result in rising bond prices because the market has already anticipated the interest rate increase. Bonds can help a portfolio as they typically can help protect a portfolio against volatility in the stock market.
For more information, watch the full February 2022 Market Update video below.
Important Disclosures: The information provided here is of a general nature and is not intended to answer any individual’s financial questions. Do not rely on information presented herein to address your individual financial concerns. Your receipt of information from this material does not create a client relationship and the financial privileges inherent therein. If you have a financial question, you should consult an experienced financial advisor. Moreover, the hiring of a financial advisor is an important decision that should not be based solely upon blogs, articles, or advertisements. Before you hire a financial advisor, you should request information about the financial advisor’s qualifications and experiences. Past performance is no guarantee of future results. All expressions of opinion are subject to change without notice in reaction to shifting market conditions. Data contained herein from third party providers is obtained from what are considered reliable sources. However, its accuracy, completeness or reliability cannot be guaranteed. Examples provided are for illustrative (or “informational”) purposes only and not intended to be reflective of results you can expect to achieve. AllGen Financial Advisors, Inc. (AllGen) is an investment advisor registered with the SEC. AllGen does not provide personal financial advice via this material. The purpose of this material is limited to the dissemination of general information regarding the services offered by AllGen. The Disclosure Brochure, Form ADV Part II, which details business practices, services offered, and related fees of AllGen, is available upon request.

