Read through our market commentary here, or skip to Jason’s April 2022 Market Update video below.
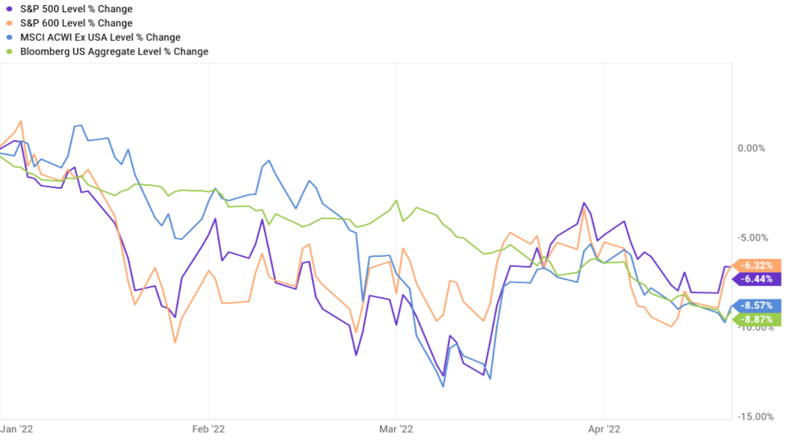
In the first quarter of 2022, markets have dealt with major events like Fed rate hikes, inflation hitting 40-year highs, and the Russian invasion of Ukraine, not to mention areas of the world are still in the latter stages of recovering from the Covid-19 pandemic. So far, 2022 has been shaky for investors, and a review of the year-to-date performance of most asset classes, most of which are down, showed that bonds have been hit the hardest. More on that later.
Inflation
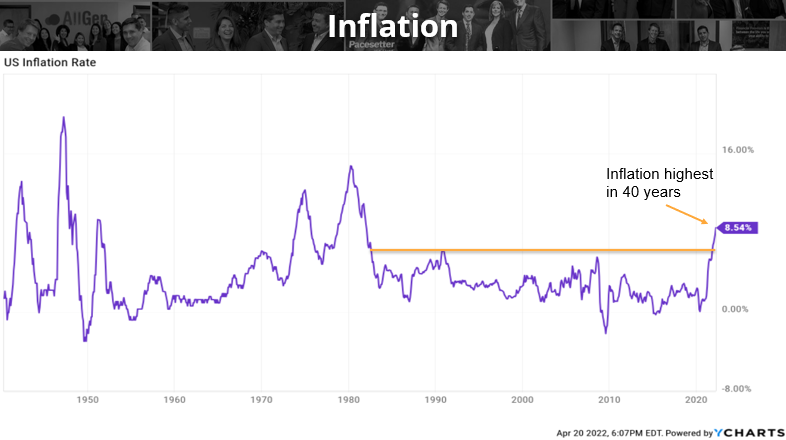
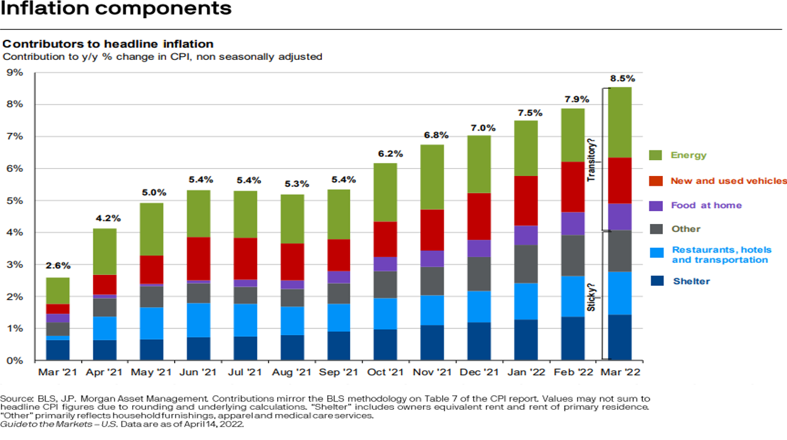
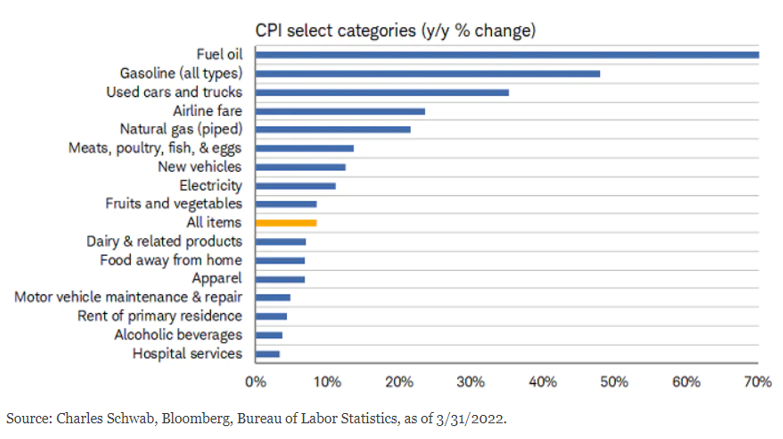
Beginning with inflation, the US inflation rate is at levels not seen since the early 1980s. When inflation began to rise in April of last year, many investors believed it would remain “transitory,” meaning temporary. Rising energy prices have contributed the most to the rise in inflation, especially recently, due to the Russian invasion of Ukraine. Russia also accounts for nearly 40% of European gas, while Russia and Ukraine combined account for nearly 30% of the world’s wheat. This has sent fuel and gas prices are up 70% and 50% for the year respectively (bottom chart below), we don’t believe that level of price inflation will continue every year at the same rate, which is why we believe inflation will come down towards the end of the year but remain elevated for an extended period of time.
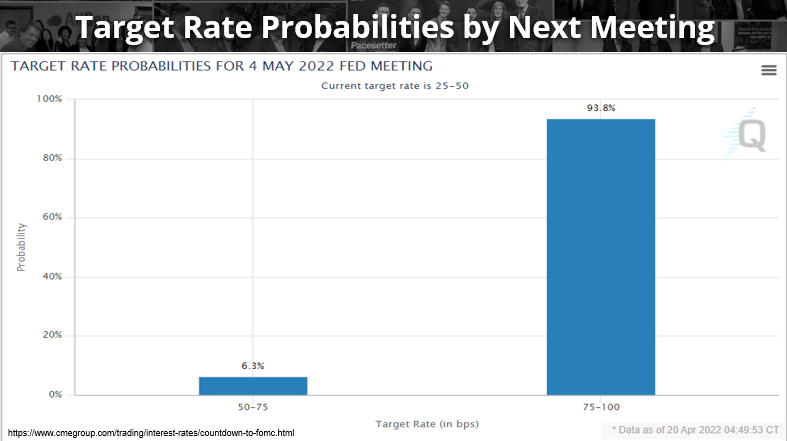
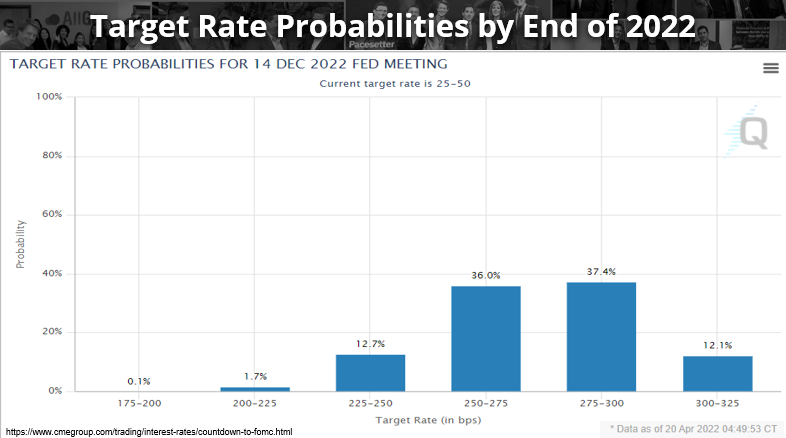
The Federal Reserve has publicly stated that it will fight inflation by raising interest rates, which can slow inflation. This process has already begun in mid-March and at the next Fed meeting in May, the market projects a 93% probability that the Fed will raise interest rates by .5% in 2 rate hikes (top chart below). Looking forward to the end of the year (bottom chart below), rates have the highest probability of reaching 2.5-3% which would indicate raising interest rates 10-11 times this year which is an extremely fast-moving Fed!
Bond Prices vs. Rates
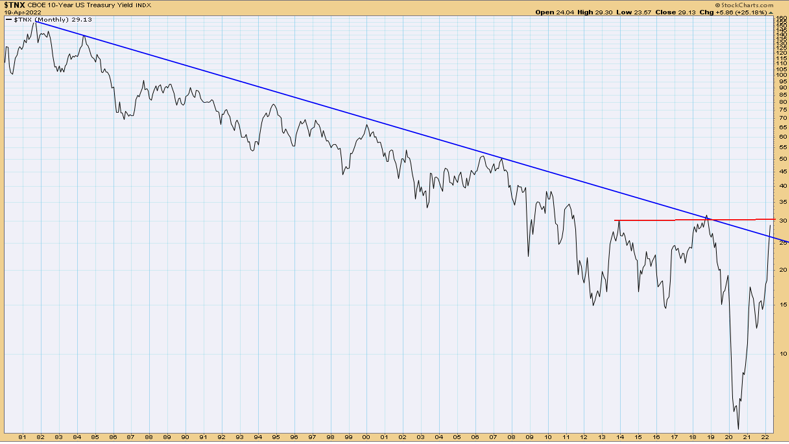
Bond prices and interest rates are inversely related. This means that when interest rates rise, bond prices fall and vice versa. However, this doesn’t usually happen right when the fed begins raising rates. Since the 1980s, rates on the 10-year bond (see below) have declined over time. Yields have been increasing lately and are now approaching a 10-year resistance level (red line). We believe there is a good chance yields will turn back down which would be good for bond prices.
We stated earlier that the Fed began lifting interest rates from 0% in March (one month ago) and will raise them 10-11 times this year. The market also projects the Fed funds rate will finish the year around 2.5-3%. Since bond prices move inversely to yields, one might think that bond prices will fall when the Fed begins to hike rates; however, the bond market has anticipated this and actually fell 10% since August of last year, 8 months ago (see below).
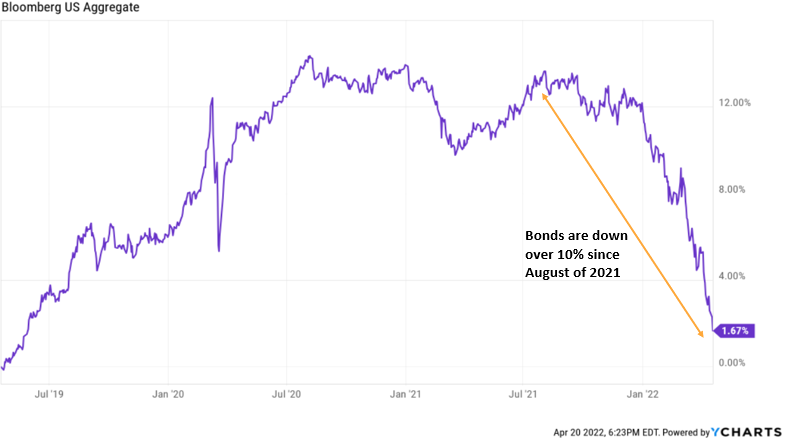
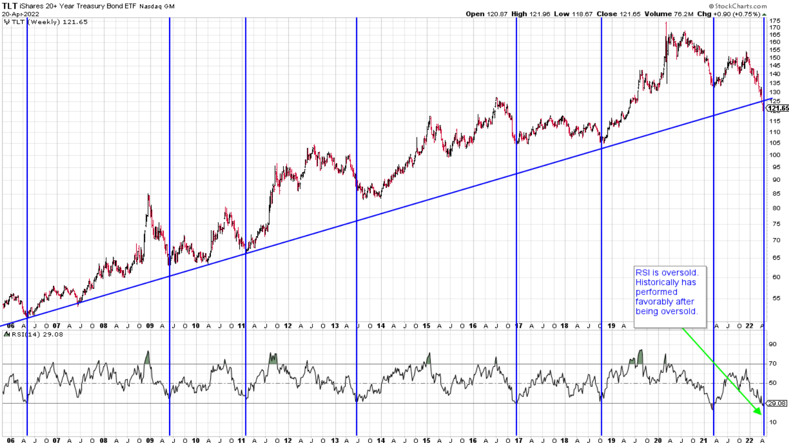
Since then, we have been underweighting bonds as the market anticipated an aggressively rising interest rate environment to combat inflation. Bond markets have seen periods of being oversold in the past and have historically been good buying opportunities. Each vertical blue line below indicates a period of overselling in the bond market over almost 20 years. We currently see signals of an oversold bond market, which is why we have been slowly increasing our bond positioning. Also, see our February market commentary here under Interest Rate Hikes where we talk about the timing of rate hikes and subsequent rising bond prices.
Quantitative Tightening
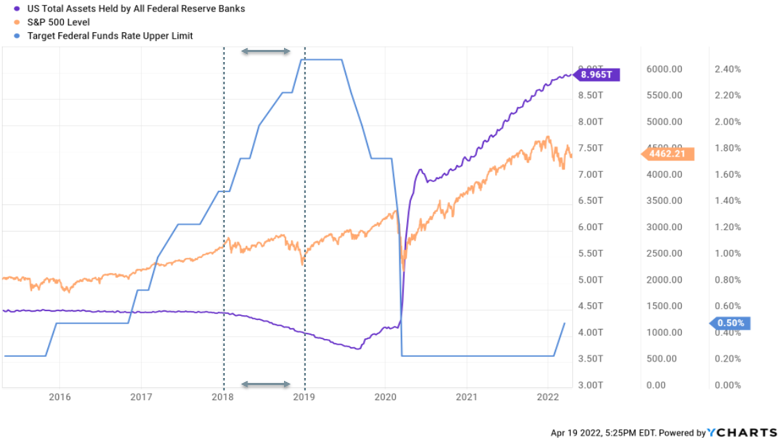
Not only does the Fed have an aggressive stance in fighting inflation by raising interest rates quickly, but it will also begin reducing the balance sheet by $95 billion per month. The last time the Fed raised interest rates while reducing the balance sheet was in 2017 at around $10 billion per month (see two vertical dotted lines). The blue line increasing represents rising interest rates and the purple line decreasing represents a reduction of the Fed balance sheet. The orange line in the middle is the S&P 500, which was a rocky time for markets. As the Fed begins an aggressive rate hike cycle, and a significantly faster balance sheet reduction, there is a higher probability we could enter a recession in the future.
Yield Curve Inversion 2/10 Year Bonds
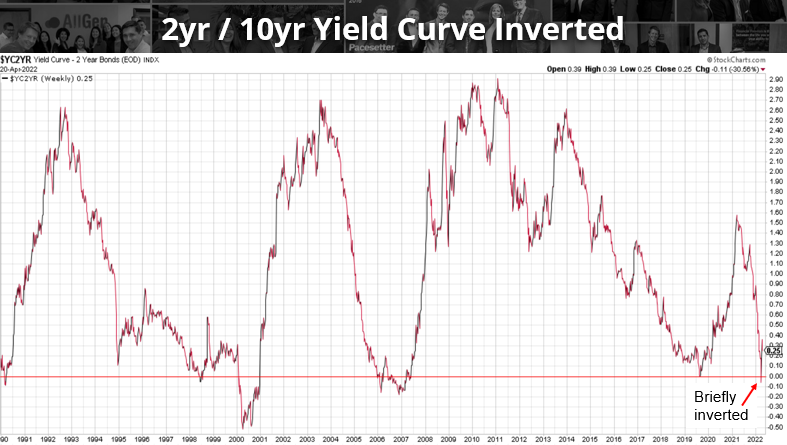
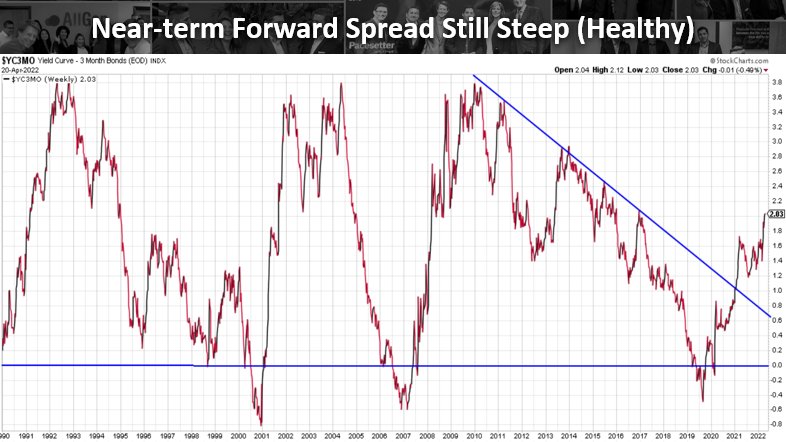
The yield curve of 2-year bonds to the 10-year briefly turned inverted recently which has historically preceded recessions by about 10-11 months. This gives portfolio managers time to prepare for potential recessions.
Recessions and Diversification
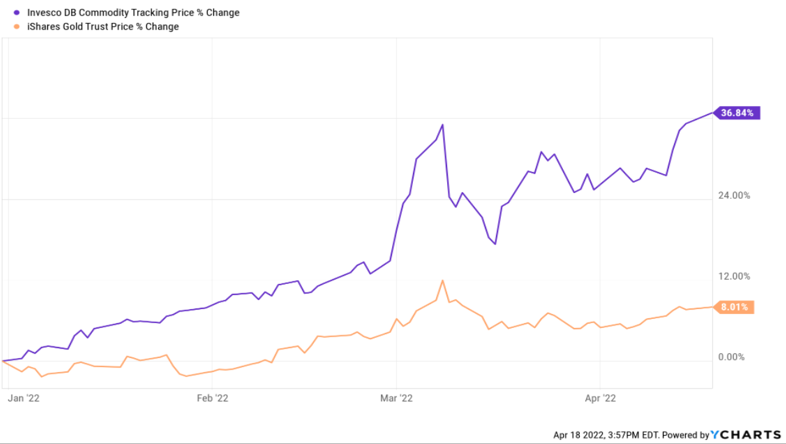
A great way to navigate a weakening market is to make sure your portfolio is properly diversified. Diversification can offer protection during events that send markets through periods of shock, like the Russian invasion of Ukraine. One important component to study is asset correlations to one another and incorporating some assets that are negatively correlated to the stock market. This can help offset potential losses by broadening market exposure, rather than overweighting one specific sector. So far in 2022, when all other asset classes are performing poorly, commodities have performed extremely well. Commodities are up nearly 37% year-to-date as of 4/18/2022 with gold up 8.01% over the same period. Incorporating assets such as these into a portfolio during uncertain economic times can provide cushioning for underperforming areas. We are currently adding to our commodity holdings, especially gold as it tests some long-term resistance levels (second chart).

Another area we are favoring in the markets is international Markets, covered more deeply in our March Market Update here: March 2022 Market Update: International and Emerging Markets, Russia-Ukraine, & More – AllGen Financial Advisors, Inc.
For more information watch the full quarterly review below.
Important Disclosures: The information provided here is of a general nature and is not intended to answer any individual’s financial questions. Do not rely on information presented herein to address your individual financial concerns. Your receipt of information from this material does not create a client relationship and the financial privileges inherent therein. If you have a financial question, you should consult an experienced financial advisor. Moreover, the hiring of a financial advisor is an important decision that should not be based solely upon blogs, articles, or advertisements. Before you hire a financial advisor, you should request information about the financial advisor’s qualifications and experiences. Past performance is no guarantee of future results. All expressions of opinion are subject to change without notice in reaction to shifting market conditions. Data contained herein from third party providers is obtained from what are considered reliable sources. However, its accuracy, completeness or reliability cannot be guaranteed. Examples provided are for illustrative (or “informational”) purposes only and not intended to be reflective of results you can expect to achieve. AllGen Financial Advisors, Inc. (AllGen) is an investment advisor registered with the SEC. AllGen does not provide personal financial advice via this material. The purpose of this material is limited to the dissemination of general information regarding the services offered by AllGen. The Disclosure Brochure, Form ADV Part II, which details business practices, services offered, and related fees of AllGen, is available upon request.

