
Read through the blog here, or skip to our Q3 2025 Market Update Video below
Key Takeaways:
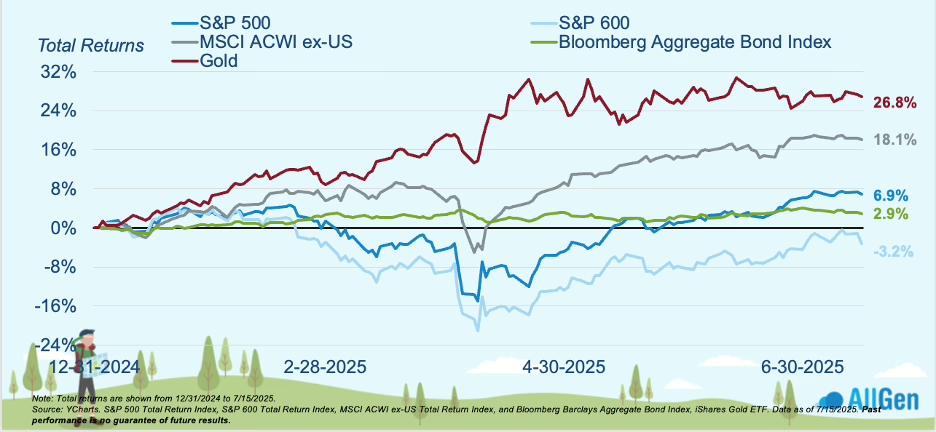
- Gold and international stocks are this year’s standouts. Gold is up over 27% and developed international stocks have significantly outperformed domestic stocks, aided by a weaker U.S. dollar.
- Fixed income is attractive again. With interest rates holding steady and potential cuts ahead, current yields tend to be indicative of forward-looking 5-year returns near 4.7% annualized.
- Diversification continues to pay off. Amidst stretched S&P 500 valuations, small cap weakness, and elevated uncertainty, portfolios with exposure beyond S. stocks have outperformed year to date (as of July 15).
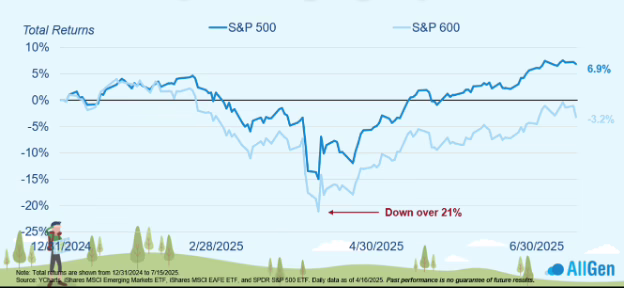
Returns for 2025
There are three themes we are watching play out in markets in 2025: 1.) high policy uncertainty in the U.S., 2.) yields are attractive in fixed income, and 3.) the U.S. economy is slowing. These themes help to explain the performance we have seen in international stocks, domestic stocks, gold, and bonds. The S&P 500 has had a bumpy ride year to date—after being down over 15% earlier in the year, it’s now up 7%. Small caps remain negative, down roughly 3%. Developed international stocks and gold are leading, up nearly 18% and 27% respectively. Bonds have delivered modest gains around 3%.
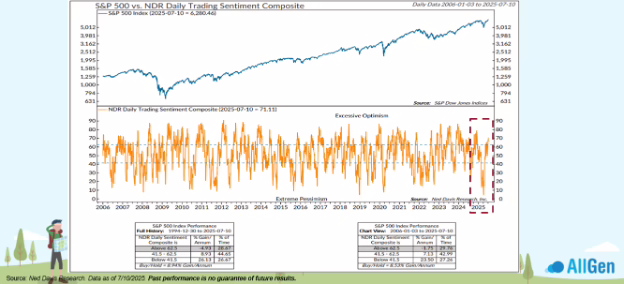
Short-term sentiment has rebounded from the lows seen earlier this year (Slide 5)
Short-term sentiment has rebounded from the lows seen earlier this year. In April, investor sentiment reached extreme pessimism, which is typically seen as a contrarian buying signal. Since then, markets have rebounded sharply. Historically, similar dips in sentiment have led to one-year returns of over 20%. Staying invested during emotional lows has once again proven to be a key factor in capturing the upside.
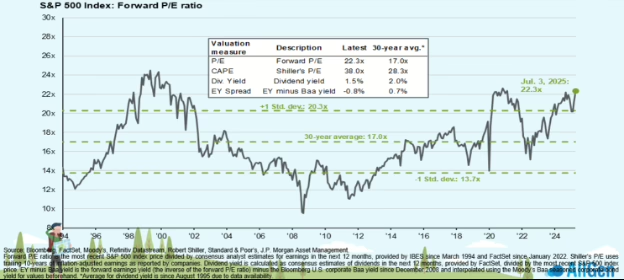
Stock valuations are a little stretched (Slide 7)
After the rebound, some investors are asking: “Are stocks too expensive now?” The forward P/E on the S&P 500 is at 22 times earnings, which above its long-term average of 17. While valuations are stretched, we are not underweighting equities at this time. Stocks still play a vital role in long-term returns, and reducing exposure prematurely could be costly. We are monitoring valuations closely while looking for attractive segments within the market.
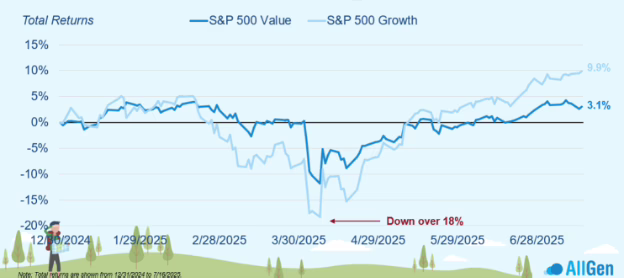
It is important to hold both growth and value stocks over the long run (Slide 8)
Market leadership has shifted throughout the year. During the April downturn, value stocks held up better. Since then, growth has rallied strongly. Rather than choosing one over the other, our approach is to maintain exposure to both. We leaned into value earlier in the year and have recently added more growth exposure to capture the upside.
Small-cap stocks are down year to date, underperforming large-cap stocks (Slide 9)
Not all areas of the market have recovered equally. Small and mid-sized companies have underperformed due to slowing GDP and higher sensitivity to economic cycles. Many small caps have negative earnings and tighter margins, making them more vulnerable to economic slowdowns. We’ve reduced our exposure to this segment and remain overweight large caps for stability.
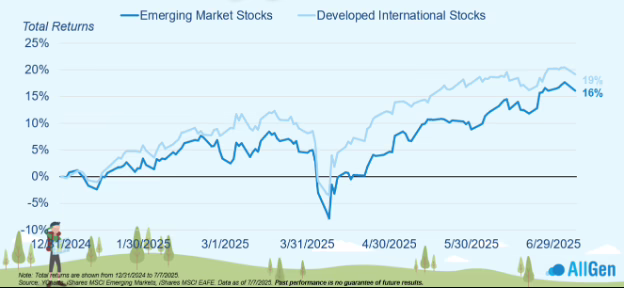
Developed international stocks are outperforming emerging market stocks (Slide 10)
International markets have rebounded strongly in 2025, contributing positively to performance in our portfolios. The reason? Currency effects. The U.S. dollar has dropped nearly 10% year to date, boosting foreign returns for American investors. This is a textbook example of why global diversification matters. It’s not just about where companies are located, but also how currency movements impact returns.
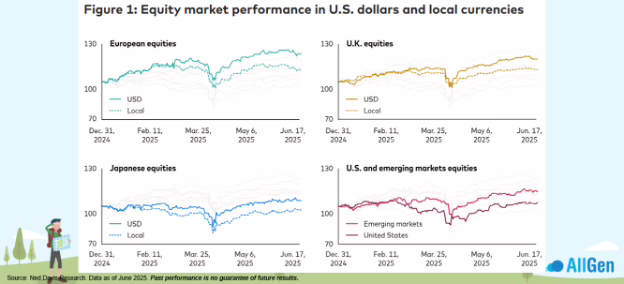
The drop in the dollar has boosted international returns for U.S. investors (Slide 12)
The dotted lines in the charts above represent local currency returns for foreign stock markets and the solid lines represent USD-denominated returns—the shows the positive impact of the weaker dollar on performance for international stocks. Remove the weaker dollar from the equation, and you see that returns from overseas markets are pretty similar to those in the U.S. year-to-date. The high policy uncertainty in the U.S. is a key reason why the dollar has dropped so much.
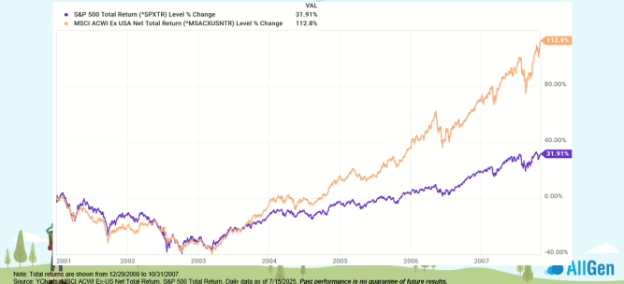
International stocks outperformed domestic in the early 2000s (Slide 13)
The past decade favored U.S. stocks, but that wasn’t always the case. From 2001 to 2007, international stocks beat the S&P 500 by a wide margin—112% cumulative vs. 32%. These cycles tend to rotate. Staying globally diversified helps us take advantage when international markets start to lead, like we’ve seen so far in 2025.
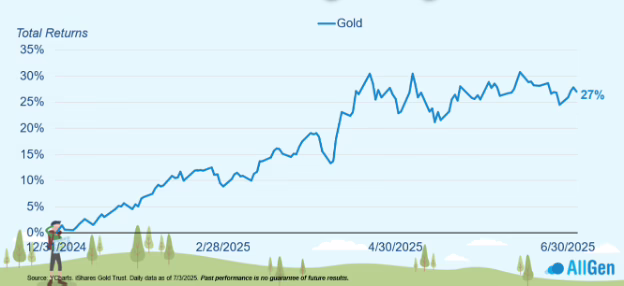
Gold is up 27% with the drop in the dollar and investors wanting to hedge risk (Slide 14)
Gold is another beneficiary of the weaker dollar—up 27% year-to-date. Central bank buying and investor demand for safety amid policy uncertainty have also supported this move. We continue to hold gold in client portfolios as a strategic hedge.
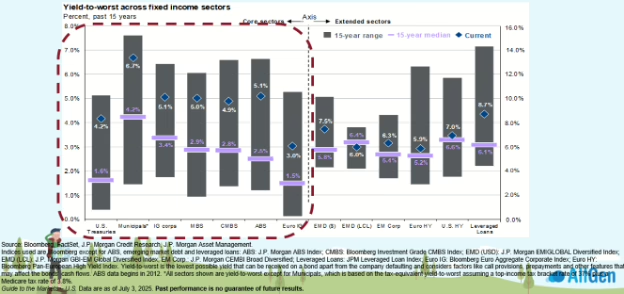
Bonds still look attractive (Slide 15)
History suggests today’s yields are a good entry point. After years of low returns, bond yields are now above their 15-year averages across Treasuries, corporates, and mortgage-backed securities. With the Fed no longer hiking aggressively, the backdrop is supportive of stable, moderate fixed-income returns.
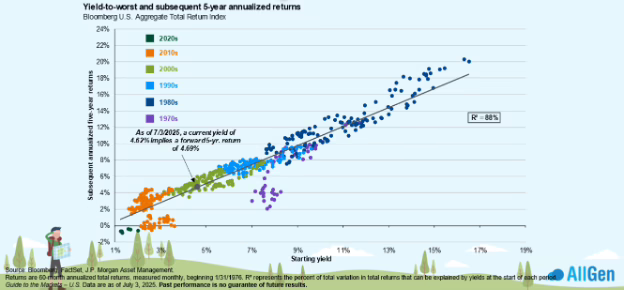
Current yields imply a 4.69% annually for the next 5 years (Slide 16)
Historically, when yields start at these levels (~4.6%), the following five-year returns average about 4.7% annually. The combination of attractive yields and less interest rate volatility makes this an opportune time to hold bonds.
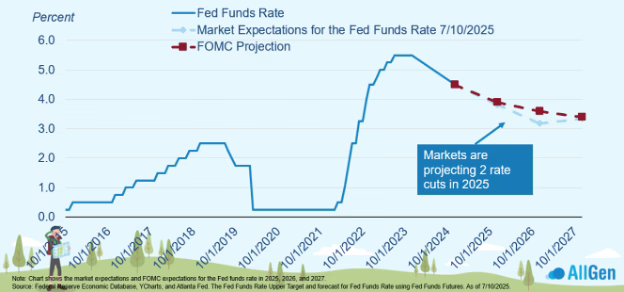
Markets are pricing in two rate cuts this year (Slide 17)
One key change contributing to the attractiveness of bonds this year: markets and the Fed are finally on the same page. Markets are pricing in two rate cuts for 2025, mirroring the Fed’s expectations. This alignment has helped reduce volatility in fixed income markets. In contrast to early 2024, there is now less pricing disconnect, meaning fewer surprises ahead.
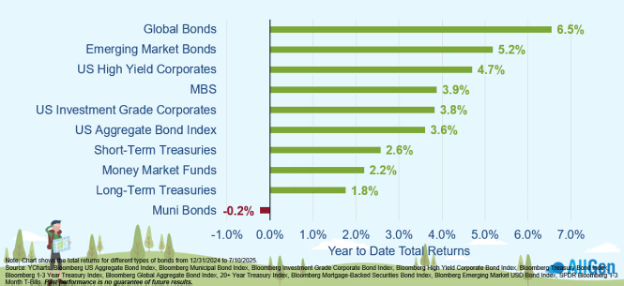
Global bonds are the best performing area of fixed income year-to-date (Slide 18)
Beyond U.S. borders, bonds are outperforming too. Global bonds are up 6.5% so far in 2025—outpacing most U.S. fixed income categories. Central bank easing overseas, the weaker U.S. dollar, and high U.S. policy uncertainty are driving this strength. After years of underperformance, global bonds are re-emerging as a valuable diversifier.
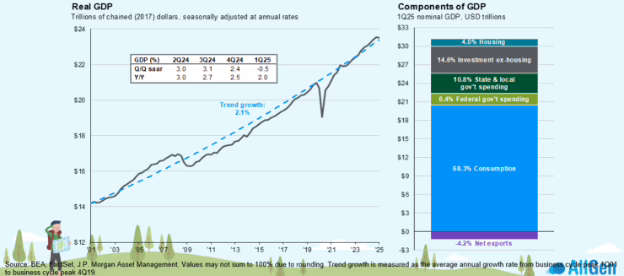
Real GDP is slowing (Slide 19)
Shifting gears to the U.S. economy, growth has cooled from 3% to around 2% growth year over year. While that’s not recessionary, it signals a move toward a late-cycle environment. Slower growth supports AllGen’s tilt toward large caps and exposure to bonds over highly cyclical assets. It’s important to our investment philosophy to lean into stability as we approach the next economic phase.
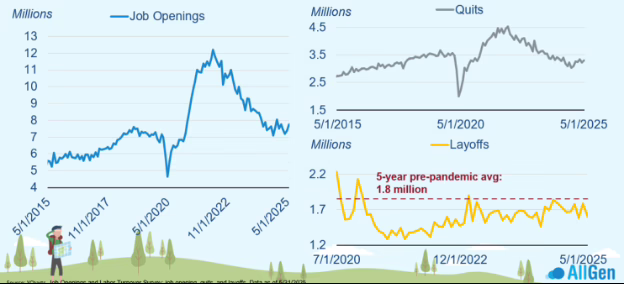
Yet, the labor market is still holding on (Slide 20)
Despite slower growth, jobs data remains solid. Job openings are still well above pre-COVID levels, and layoffs are historically low. Businesses are reluctant to let go of workers they struggled to hire, which has helped support consumer spending. A strong labor market provides a crucial cushion for consumers spending and economic resilience.
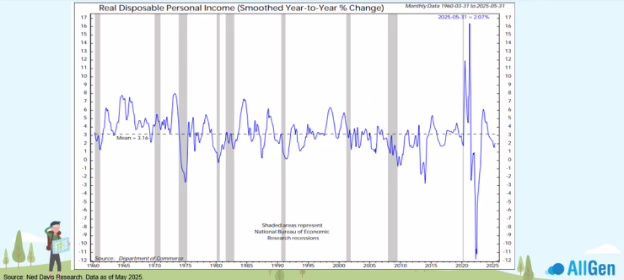
Consumers may be feeling their finances tighten, but are still generally okay (Slide 21)
With consumer spending making up almost 70% of GDP, we like to monitor consumer finances. There are signs of strain, but no cracks just yet. Rising costs and depleted pandemic savings are making some consumers feel stretched, especially lower-income households. Still, broad consumer financial health is intact. Most Americans remain employed and are spending cautiously but steadily. Monitoring shifts in consumer behavior is key to understanding what’s next.
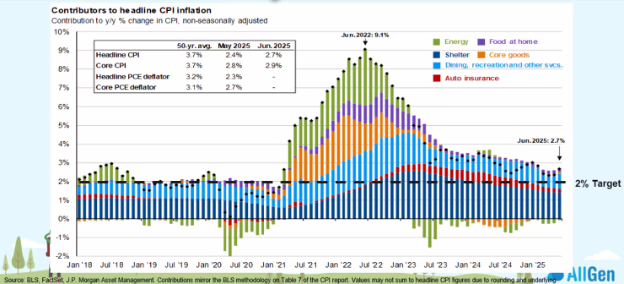
Shelter is holding steady, keeping inflation above 2% (Slide 23)
Shelter inflation, a major component of CPI held steady ringing in around 3.8% year over year in both May and June. If we see shelter inflation stay elevated above 2%, we expect to see inflation stay above the Fed’s 2% target. We also saw price shocks in very specific areas of spending such as furniture and baby goods, yet those areas account for such a small percentage of over consumer spending that it didn’t move the needle much in May or June. We hold Treasury inflation protected securities in our portfolios and gold to protect against a spike in inflation even though it is not our base case.
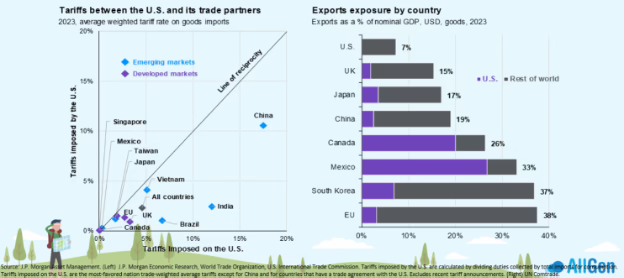
Tariffs are a wildcard thrown in the mix (Slide 24)
Trade policy has been a major source of market uncertainty, and the devil is in the details—as always. One way to look at tariffs is through the lens of finding the equilibrium point (shown as the line of reciprocity in the chart above). If the U.S. imposed tariffs and the tariffs imposed by the foreign county on the U.S. are roughly equal, that country will show up near or on the line of reciprocity. As you can see, renegotiating trade deals with countries like China, India, or Brazil makes sense given the distance from the line of reciprocity. Other countries like Singapore or Canada are already at or near equilibrium and perhaps didn’t have as strong of a need for renegotiating a trade deal. Given the decrease of the effective tariff rate from 30% in April down to 15% in July and positive progress in trade negotiations, we hope to see more clarity around tariffs in the coming months as markets do not like uncertainty. If not, then we also hold gold, which may help the portfolios weather any volatility.
Summary
To wrap this all up, the first six months of 2025 prove that the S&P 500 is no longer the only game in town. International stocks are having their heyday, outperforming the S&P 500 by over 11% as of mid-July. Gold is also having a great year (up ~27% year-to-date) and bond yields are supportive of 3-5% returns annualized over the next five years. We are keeping an eye on the high U.S. policy uncertainty and managing portfolios in a risk-conscious way. Central to our investment philosophy is managing risk first to help portfolios hold up better over the long run. If you have any questions about your portfolio or would like to revisit your financial plan, please reach out to your advisor.
Contact Your Financial Advisor
A well-diversified, disciplined strategy that manages risk first is what we strive to build for our clients. Contact your advisor to learn more about how AllGen can help manage risk in your portfolio!
For more information, watch the full July 2025 Market Update video below.
Important Disclosures: The information provided here is of a general nature and is not intended to answer any individual’s financial questions. Do not rely on information presented herein to address your individual financial concerns. Your receipt of information from this material does not create a client relationship and the financial privileges inherent therein. If you have a financial question, you should consult an experienced financial advisor. Moreover, the hiring of a financial advisor is an important decision that should not be based solely upon blogs, articles, or advertisements. Before you hire a financial advisor, you should request information about the financial advisor’s qualifications and experiences. Past performance is no guarantee of future results. All expressions of opinion are subject to change without notice in reaction to shifting market conditions. Data contained herein from third party providers is obtained from what are considered reliable sources. However, its accuracy, completeness or reliability cannot be guaranteed. Examples provided are for illustrative (or “informational”) purposes only and not intended to be reflective of results you can expect to achieve. AllGen Financial Advisors, Inc. (AllGen) is an investment advisor registered with the SEC. AllGen does not provide personal financial advice via this material. The purpose of this material is limited to the dissemination of general information regarding the services offered by AllGen. The Disclosure Brochure, Form ADV Part II, which details business practices, services offered, and related fees of AllGen, is available upon request.


