
The Long and Short of It:
– The economy is strong, however, bad breadth and negative divergences in the markets could be a warning sign
– The trend of the 10-year US Bond yield broke out of its 36-year downtrend
3rd Quarter Review
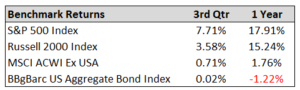
US stocks had a solid 3rd quarter continuing off their strength from the second quarter. US large caps led the way with a 7.7% return. While US stocks posted a strong gain, international stocks posted only a small gain – possibly from the negative effects of trade tensions and a stronger dollar. Bonds were flat for the quarter and down for the year as the FED raised rates another 0.25%. In this quarter’s market commentary, we look at a few warning signs in the market, the long-term trend change of the 10-year US Treasury Bond, and how that affects stocks and bonds.
Warning Signs in the Market
There is much to get excited about in the US economy, so it may sound contrarian to talk about warning signs. Consumer confidence is near all-time highs, unemployment is at 48-year historic lows, GDP is growing over 4%, and small business confidence is at record highs. While all these indicators seem like good signs, most market tops occur when these indicators look extremely strong and conversely most market bottoms occur when these indicators look extremely bad. The reason for this is because the stock market usually leads the economy. People in the know (Company insiders, institutional money managers, etc.) will usually sell at the first sign that things are starting to peak, rather than waiting for the economic indicators to warn them. While it is important to study the economic indicators and the fundamental indicators, it is also important to look at the charts of the stock markets to get clues of things to come. On that note, we have spotted a few negative divergences that could point to a pull-back in stocks. A negative divergence is when the price chart of the stock or index is hitting higher highs, but the indicators are starting to decline by forming lower highs.
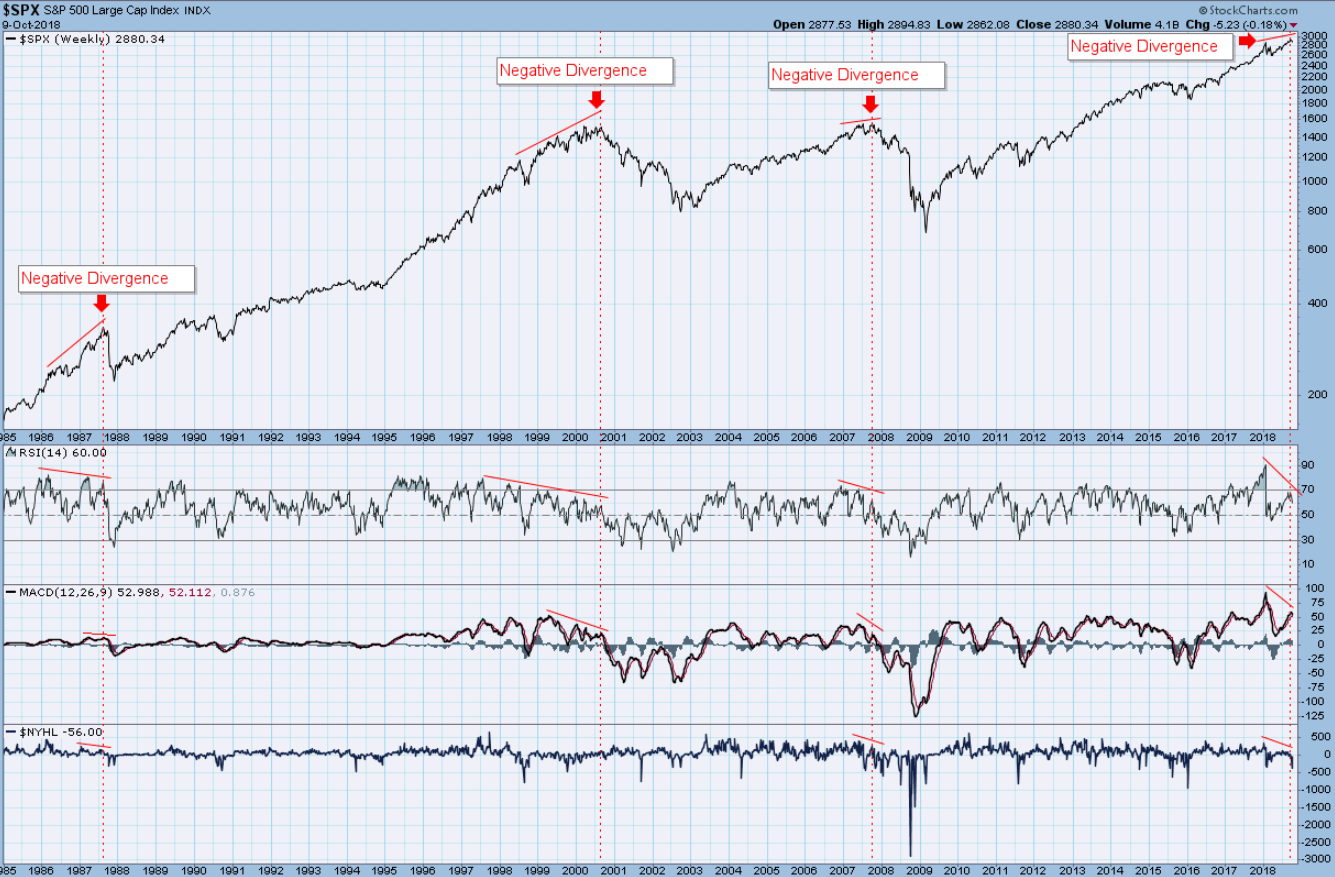
Typically, in a strong market the momentum indicators will trend higher along with the stock or index, confirming its strength. However, when the stock prices hit higher highs while the indicators are unable to hit higher highs, this signals a loss of momentum and usually precedes a price drop. The chart above shows the S&P 500 (on top) along with the RSI, MACD, and New Highs and Lows (indicators from top to bottom) going back to 1985. I’ve drawn a vertical dotted red line to mark prior major market tops prior to their drop (1987, 2000, and 2007) and today’s market (furthest vertical dotted line on the right). Each one of the prior market tops showed a negative divergence, where the S&P 500 hits a higher high and the indicators below hit a lower high. The current market is showing a clear negative divergence. Also, as the S&P 500 was recently hitting all-time highs there were just as many stocks hitting new 52-week lows as there were 52-week highs. Plus, there were more stocks trading below their 200-day moving average than above it. This is what is called bad breadth (nothing to do with dental hygiene 😊). Typically, when a market is strong the breadth is strong, which means the majority of stocks are participating in the upward move. On the other hand, it is a negative sign when most of the stocks are not participating in the rising market. While there is no perfect indicator with 100% accuracy when you get a confluence of indicators showing warning signs it may be a time to take some caution.
Long Term Trend Change in the 10-Year US Treasury Bond
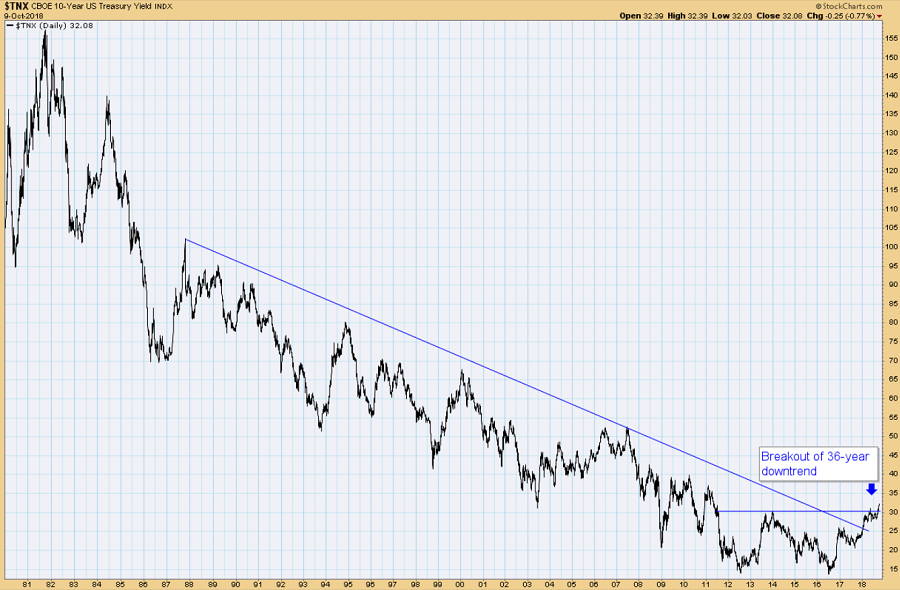
The Federal Reserve (FED) recently raised rates another 0.25% and commented that the economy is “remarkably positive.” This leaves the door open for the FED to continue to raise rates into the foreseeable future. At the same time, as we have mentioned in prior market commentaries, the FED continues to do quantitative easing. Quantitative easing also puts upward pressure on interest rates. These two forces have led to interest rates recently rising to 7-year highs and breaking out of a 36-year downtrend (see chart below for the 10-year US Treasury bond yield).
Rising interest rates tend to slow down the economy. People and companies that are in debt will see their borrowing costs rise, which means reduced cashflow. Reduced cash flow means less spending. In a consumption-based economy, like the US, less spending can slow down the economy. Higher interest rates can also be negative for bond prices as bond prices typically go down when interest rates rise.
Going Forward
While the economy is strong some technical indicators are showing warning signs of a possible market top. Interest rates have recently broken into new 7-year highs. While our bond positioning is already defensively postured we are looking into going more defensive on the stock side of our portfolios. We will continue to monitor the markets, economies, interest rates, currencies, sentiment, and many other indicators to try to stay ahead of the markets as we look to preserve and grow our client’s wealth. Our investment philosophy is to manage risk first in an effort to avoid a major loss, as we seek to outperform markets over a full market cycle net of our management fee. We appreciate your trust and confidence in us!
Written by: Jason Martin, CFP®, CMT, Chief Investment Officer, Paul Roldan, Chief Executive Officer; Christina Shaffer, Junior Analyst Allgen Financial Advisors, Inc.;
Important Disclosures: The information provided here is of a general nature and is not intended to answer any individual’s financial questions. Do not rely on information presented herein to address your individual financial concerns. Your receipt of information from this material does not create a client relationship and the financial privileges inherent therein. If you have a financial question, you should consult an experienced financial advisor. Moreover, the hiring of a financial advisor is an important decision that should not be based solely upon blogs, articles, or advertisements. Before you hire a financial advisor, you should request information about the financial advisor’s qualifications and experiences. Past performance is no guarantee of future results. All expressions of opinion are subject to change without notice in reaction to shifting market conditions. Data contained herein from third party providers is obtained from what are considered reliable sources. However, its accuracy, completeness or reliability cannot be guaranteed. Examples provided are for illustrative (or “informational”) purposes only and not intended to be reflective of results you can expect to achieve. AllGen Financial Advisors, Inc. (AllGen) is an investment advisor registered with the SEC. AllGen does not provide personal financial advice via this material. The purpose of this material is limited to the dissemination of general information regarding the services offered by AllGen. The Disclosure Brochure, Form ADV Part II, which details business practices, services offered, and related fees of AllGen, is available upon request.


